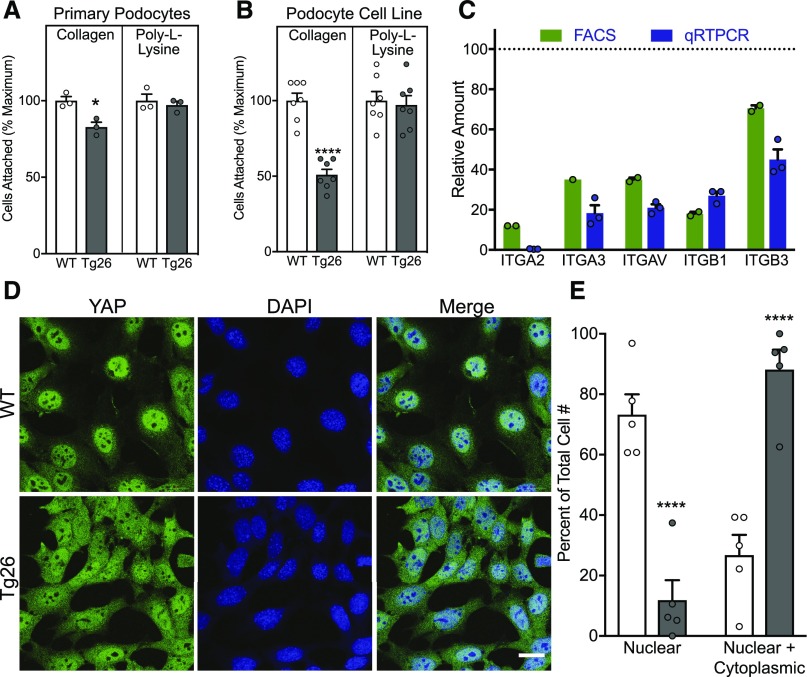
Figure 6.
Defective integrin-mediated adhesion and traction of Tg26 podocytes. Adhesion of (A) normal WT and Tg26 primary podocytes and (B) WT and Tg26 podocytes on collagen (type 1) and poly-l-lysine quantified using crystal violet staining of attached cells. Each bar represents the mean of four experiments, with triplicate wells in each experiment. Values are expressed as a percentage of the maximum OD reading for an experiment (highest value for the WT). *P<0.05 versus control by paired t test; ****P<0.0001 versus control by paired t test. (C) Comparison of cell surface integrin expression by FACS analysis (green) or mRNA levels by quantitative RT-PCR (qRT-PCR; blue) for indicated integrins characteristic of Tg26 podocytes compared with the WT. FACS values represent the combined results from two separate experiments with duplicate samples. qRT-PCR values represent the mean relative expression values of four separate experiments ±SEM. All bars are significantly lower than WT values. (D) Localization of YAP in WT and Tg26 podocytes. Cells were plated on type 1 collagen–coated glass coverslips and stained for YAP (green) and 4′,6-diamidino-2-phenylindole (DAPI; blue) for nuclei; then, they were imaged using confocal microscopy. (E) Comparison of YAP distribution in WT and Tg26 cells. Ten fields of WT and Tg26 podocytes (approximately 100 cells in each group) were evaluated by four independent observers and assigned either a nuclear or a nuclear and cytoplasmic distribution. Results are percentage of WT or Tg26 cells with either a nuclear or a nuclear and cytoplasmic distribution ±SEM. ****P<0.0001 by two-way ANOVA followed by the Sidak comparison with the matched WT.

