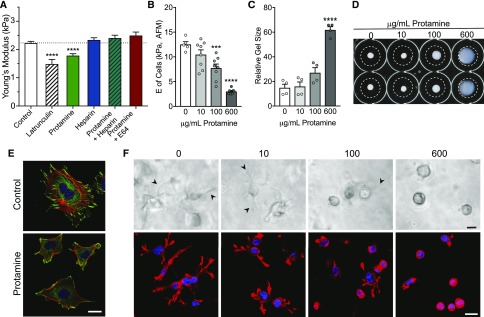
Figure 8.
Protamine causes increased deformability of glomeruli and reduced podocyte adhesion, and it disrupts podocyte cytoskeletal structure and contractility. (A) E of isolated glomeruli was measured with microindentation. Glomeruli were treated as indicated with latrunculin (1 μM), protamine 600 μg/ml, or heparin sulfate (0.1 U/ml) for 2 hours before measurements. For studies with protamine and heparin or E64, heparin (0.1 U/ml) or E64 (10 μM) was added 10 minutes before addition of protamine (600 μg/ml). Latrunculin that depolymerizes F actin reduced E from 2.2±0.05 kPa (n=23; control) to 1.5±0.15 kPa (n=5) and protamine to 1.7±0.08 kPa (n=20), and heparin increased E to 2.3±0.07 kPa (n=13). Pretreatment of glomeruli for 10 minutes with heparin or E64 before addition of protamine prevented the protamine-induced reduction in E (2.4±0.09 kPa [n=14] and 2.5+0.1 kPa [n=7], respectively). ****P<0.0001 by ANOVA with the Dunnett multiple comparisons test.12,23 (B) Measurement of podocyte cell membrane E using atomic force microscopy (AFM). Podocytes grown on collagen type 1–coated glass were treated with 10, 100, or 600 μg/ml protamine for 2 hours. Eight to ten measurements were made on ten cells in each dose group using AFM. Each error bar represents the mean±SEM of measurements of ten cells. ***P<0.01, and ****P<0.0001 versus control by paired t test. (C) Equal numbers of podocytes (4×10⁴) were treated with protamine (0, 10, 100, or 600 μg/ml) for 30 minutes before mixing in gels. Gels were allowed to polymerize for 60 minutes, imaged, released from the dishes, and treated with FBS. Podocyte collagen matrix contraction was quantitated essentially as described above (Figure 7). Relative gel sizes shown are averages of three independent experiments (n=3) performed in duplicate. ****P<0.0001 by ANOVA (GraphPad Prism). (D) Representative images of collagen gels at the end point of floating matrix assay. (E) Confocal images of control and protamine-treated (600 μg/ml; 30 minutes before fixation) podocytes. Red indicates rhodamine-phalloidin (F actin), green indicates vinculin (focal adhesions), and blue indicates 4′,6-diamidino-2-phenylindole (DAPI; nuclei). Scale bar, 20 μm. (F) Representative images of cells in three-dimensional collagen matrices taken after 1 hour of gel polymerization before matrix was released from the substrate and allowed to float. Arrowheads point to podocyte extensions that are progressively less visible with increasing protamine dose and absent in cells with the 600-μg/ml dose in three-dimensional culture. Lower panels show F actin–stained (phalloidin) and nuclei-stained (DAPI) confocal images taken after 2 hours of 20% FBS treatment. Protamine treatment of podocytes reduces extensions in response to FBS in a dose-dependent manner. Scale bars, 20 μm in upper panels; 75 μm in lower panels.

