Figure 5.
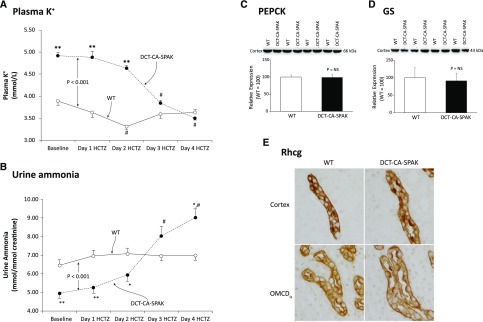
HCTZ administration reverses the effects of DCT-CA-SPAK on plasma K, urine ammonia, and expression of PEPCK, GS and Rhcg. Subfigure (A) shows effects of HCTZ on plasma K+. Subfigure (B) shows urinary ammonia excretion on each of 4 days of HCTZ administration. #P<0.01 versus baseline; *P<0.05 versus WT; **P<0.01 versus WT. n=6 in each genotype. Subfigure (C) shows there was no significant difference in PEPCK expression between HCTZ-treated WT and DCT-CA-SPAK mice. Subfigure (D) shows there was no significant difference in GS expression between HCTZ-treated WT and DCT-CA-SPAK mice. Subfigure (E) shows the absence of detectable differences in Rhcg immunolabel in the CCD (top row) and collecting duct in the inner stripe of the outer medulla (bottom row) of HCTZ-treated WT (left column) and DCT-CA-SPAK (right column) kidney. n=4 for each group. DCT-CA-SPAK, mice with early DCT-specific over-expression of constitutively active SPAK; WT, wild-type mice.

