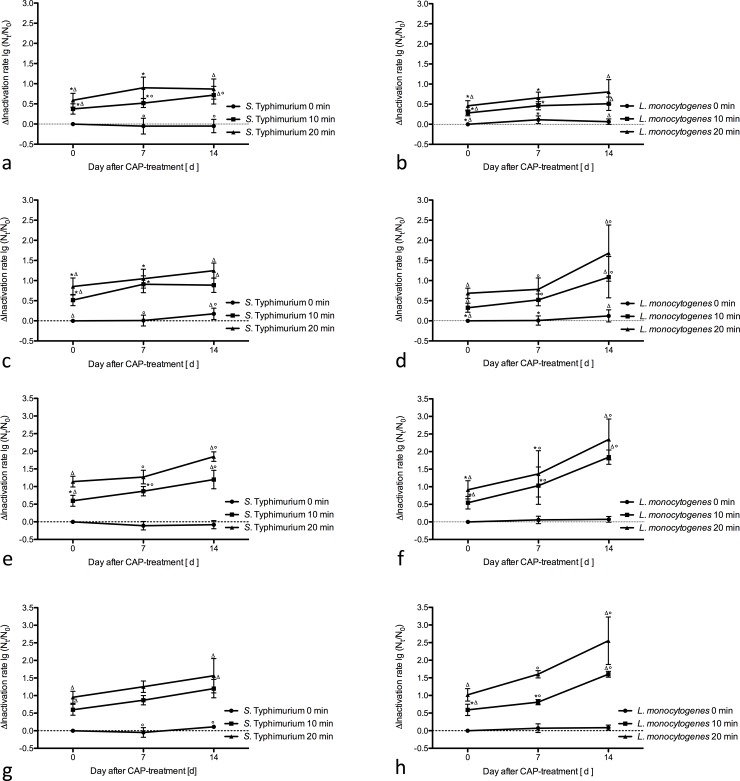
Fig 3. Inactivation of S. Typhimurium and L. monocytogenes during storage.
Results represent the ± standard error in lg CFU/g as a difference to the control group. Same symbols indicate significant differences between control group and plasma treated and stored sample for one treatment time. Significance is defined as p<0.05. The groups ‘S. Typhimurium 0 min’ and ‘L. monocytogenes 0 min’ were negative controls. * = significant difference between day 0 and 7. Δ = significant difference between day 0 and 14.° = significant difference between day 7 and 14. a = I. S. Typhimurium (6.4 kV, 10 kHz, wet). b = I. L. monocytogenes (6.4 kV, 10 kHz, wet). c = II. S. Typhimurium (6.4 kV, 10 kHz, dry). d = II. L. monocytogenes (6.4 kV, 10 kHz, dry). e = III. S. Typhimurium (10 kV, 2 kHz, wet). f = III. L. monocytogenes (10 kV, 2 kHz, wet). g = IV. S. Typhimurium (10 kV, 2 kHz, dry). h = IV. L. monocytogenes (10 kV, 2 kHz, dry).

