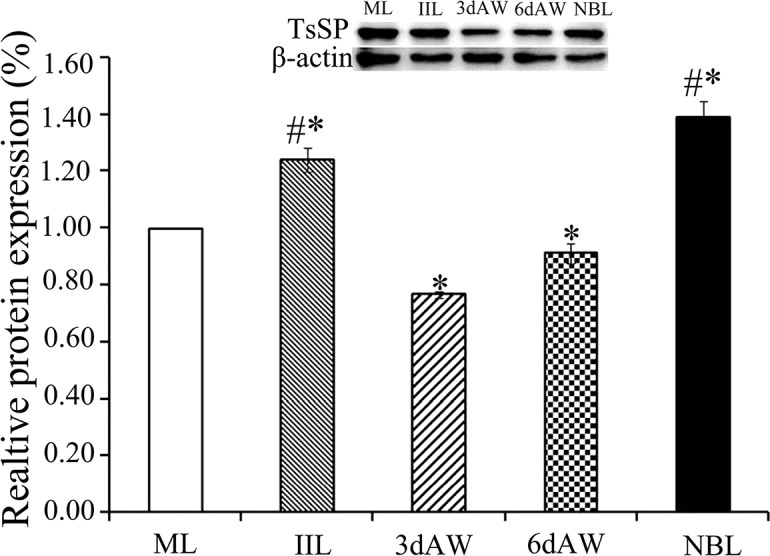
Fig 9. Western blot analyses of the TsSP expression levels at diverse T. spiralis phases.

Expression levels of TsSP protein with 45.2kDa in crude antigens of diverse T. spiralis phase (AW, NBL, ML and IIL) were determined by Western blot with 1:100 dilutions of anti-rTsSP serum. The graph reveals the relative protein expression assayed with densitometry in 3 independent experiments. Asterisk (*) shows statistical differences (P < 0.05) relative to the ML. Pound sign (#) indicates remarkably statistical differences (P <0.01) relative the ML.
