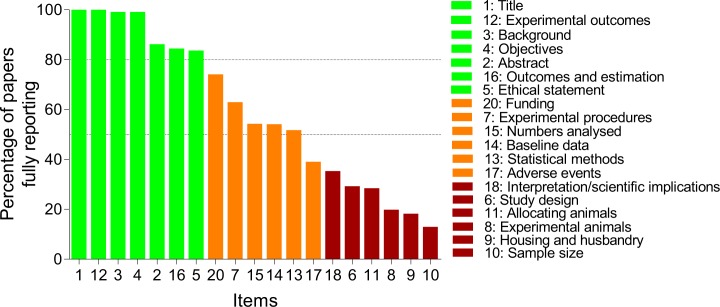
Fig 2. Bar graph of papers fully reporting individual items from the ARRIVE checklist.
Data from papers published in 2015 were pooled from ARRIVE supporting (SUPP, n = 61 papers) and non-supporting (nonSUPP, n = 55 papers) journals. Broken horizontal lines indicate reporting quality thresholds: excellent (> 80%), average (50–80%) and poor (< 50%) [12].

