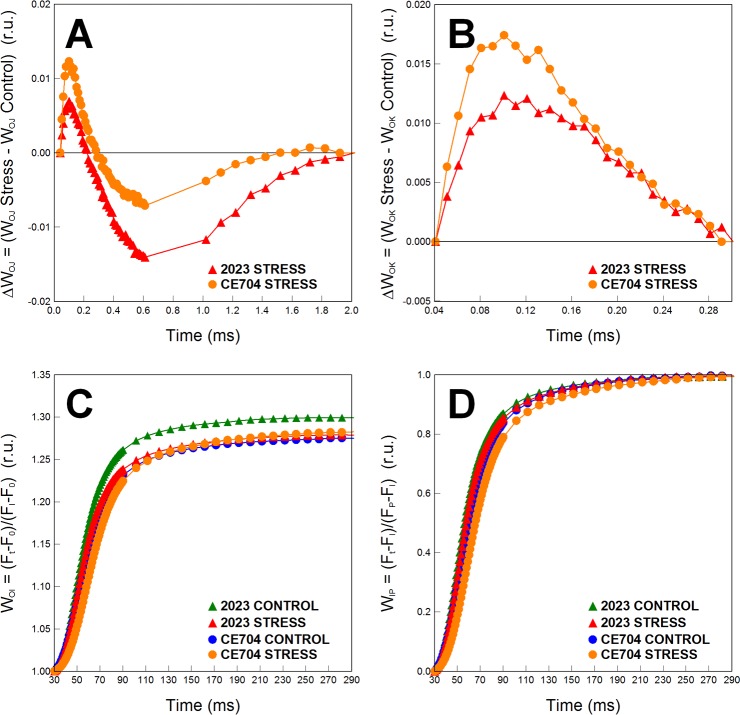
Fig 4. The difference kinetics and the relative variable fluorescences calculated from OJIP analysis of two maize genotypes (2023 and CE704).
The difference kinetics ΔWOJ (A) reveals the K-band; ΔWOK (B) reveals the L-band. Only the part between the I and P points of the OJIP curve is shown for the relative variable fluorescence WOI (C). The normalization of OJIP curve between the I and P points with the maximum amplitude fixed as 1 is shown as the relative variable fluorescence WIP (D). Plants were subjected either to normal watering (control) or to 14 days of withholding water (stress). ΔWOJ and ΔWOK were calculated from the comparisons of the stressed and control plants; the latter are represented by the zero point of the respective y axes in graphs A and B. Mean values (n = 8) are shown. r.u. … relative units.

