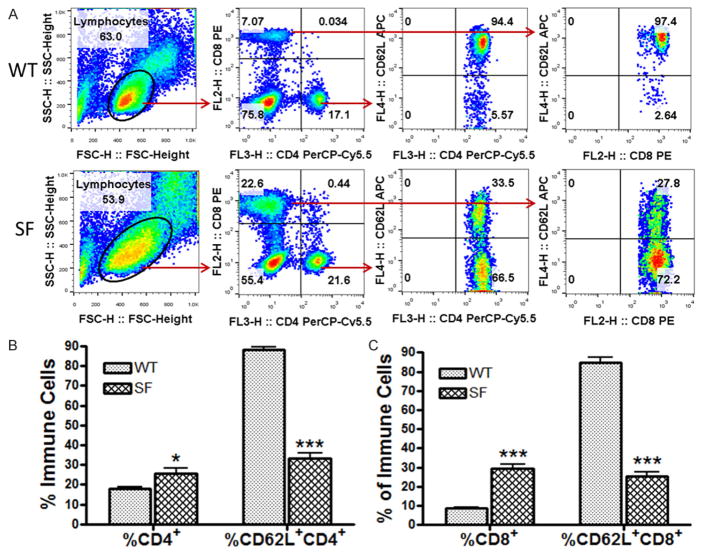
Figure 2.
A comparison of the frequencies of T cell subsets, including CD4+ T cells, CD62L+CD4+ T cells, CD8+ T cells, and CD62L+CD8+ T cells in the peripheral blood of SF and WT mice. (A) The definition of cell subsets and a comparison between SF and WT lymphocyte populations are shown by representative flow cytometry plots. The % of CD4+ and CD8+ T cells were defined among the lymphocyte population; and subsequently the % of CD62L+ cells in the CD4+ T cell population and in the CD8+ T cell population were defined. (B, C) Bar graphs compare the % of CD4+ T cell and CD62L+CD4+ T cell (B); CD8+ T cell and CD62L+CD8+ T cell (C) in the peripheral blood of SF (n = 22) with WT (n = 19) mice. Numbers represent means ± SE, *P<0.05, ***P<0.001.

