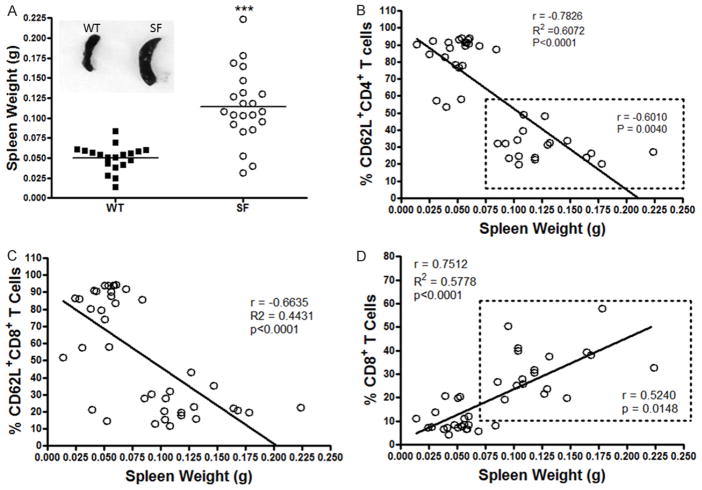
Figure 3.
Correlation between the % of T cell subsets in peripheral blood and spleen weight. A. The difference of the spleen weight of SF compared to WT mice. Each dot represents one animal, SF n = 22, WT n = 19. Mean ± SE, ***P<0.001. B. A negative correlation between the % of CD62L+CD4+ T cells and spleen weight was observed, r = −0.7826, P<0.0001. Shown are two separate clusters of CD62L cells: WT with a higher % CD62L+CD4+ T cells and SF with lower % of CD62L+CD4+ T cells, as shown in the dotted rectangle. We observed a significant negative correlation between the % of CD62L+CD4+ T cells and the weight of the spleen in SF group, r = −0.6010, P = 0.0040. C. A negative correlation between % of CD62L+CD8+ T cells and spleen weight was noted, when we analyzed all mice, r = −0.6635, P<0.0001. D. A positive correlation between % of CD8+ T cells and splenic weight was observed (when we analyzed all mice), r = 0.7512, P<0.0001; but a positive correlation between % of CD8+ T cells and splenic weight was also noted in the SF group, as shown in the dotted rectangle, r = 0.52401, P = 0.0148.

