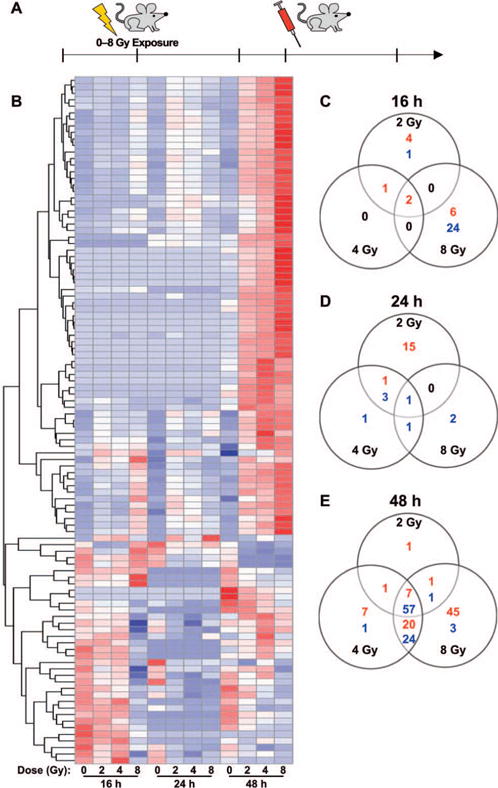
FIG. 1.

Whole genome expression analysis revealed lncRNA profiles changing in response to radiation. Panel A: Schematic showing experimental design (three mice/dose/time point were irradiated). Panel B: Heat map showing regulated lncRNA probes at 16, 24 and 48 h postirradiation. The lncRNA probes were clustered by hierarchical clustering using Euclidean distance metric. Panels C–E: Venn diagrams show the distribution of differentially regulated lncRNA probes across the dose points at 16, 24 and 48 h postirradiation, respectively. At each time point, ANOVA is followed by Dunnett’s t test to show the significant changes (FDR ≤ 0.01, intensity ratio ≥2 or ≤0.5) between irradiated (2, 4 and 8 Gy) and sham-irradiated controls. The number of up- and downregulated lncRNA probes are indicated in red and blue, respectively.
