
FIG. 2.
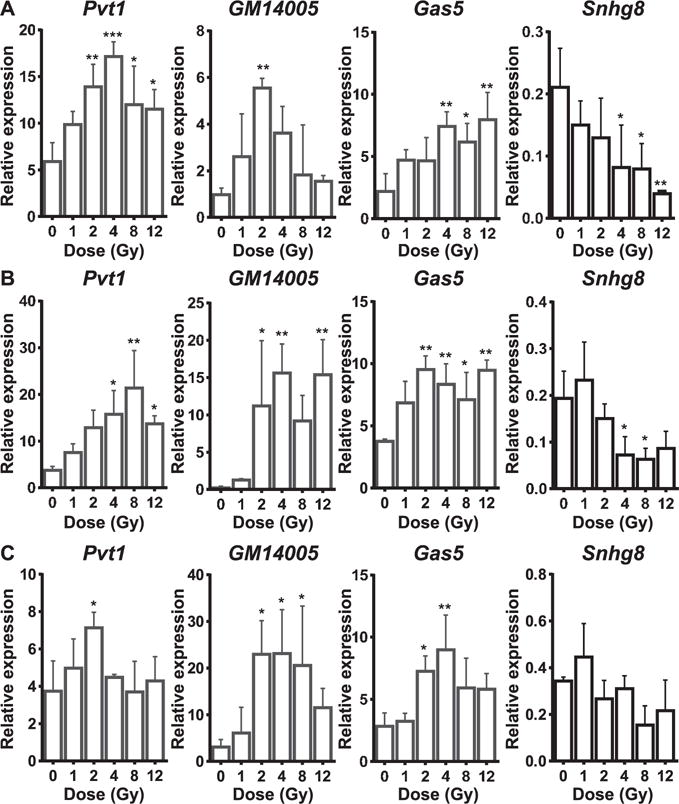
RT2 lncRNA PCR Array mouse lncFinder profiling of several characterized lncRNAs as radiation targets. Panels A–C: Bar graphs show dose responsiveness of Pvtl, Gm14005 and Gas5 and Snhg8 at 16, 24 and 48 h postirradiation, respectively. Relative expressions (2−dCt) are plotted across doses. dCt was calculated against endogenous control gene, Gt(ROSA)26Sor. All graphs show mean ± SD from three animals/dose/time point. ANOVA followed by a Dunnett’s post hoc test (treatments compared to control) was performed to compute statistical significance. *P < 0.05; **P < 0.01 and ***P < 0.001.