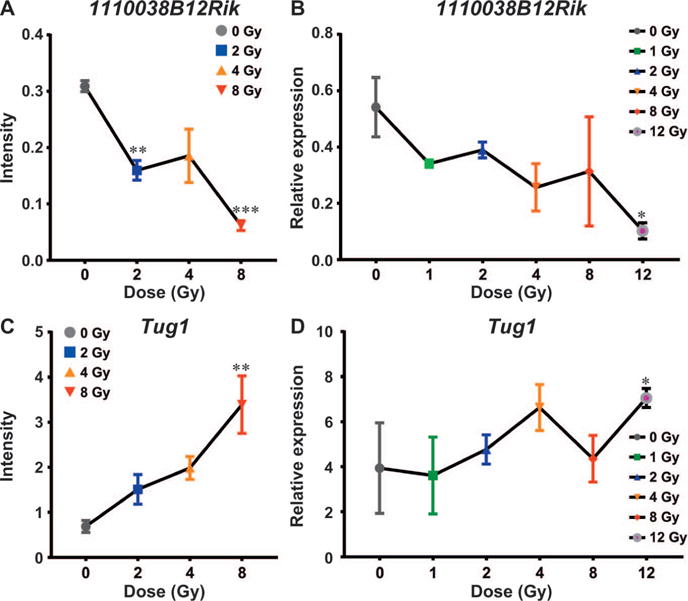
FIG. 3.

Comparison of 1110038B12Rik and Tug1 between the microarray and the lncFinder data. Panels A and B: Line graphs showing downregulation of 1110038B12Rik in response to increasing radiation doses at the 16 h time point in the microarray and lncFinder data, respectively. Panels C and D: Line graphs showing upregulation of Tug1 in response to increasing radiation doses at the 48 h time point in the microarray and lncFinder data. *P < 0.05; **P < 0.01 and ***P < 0.001.
