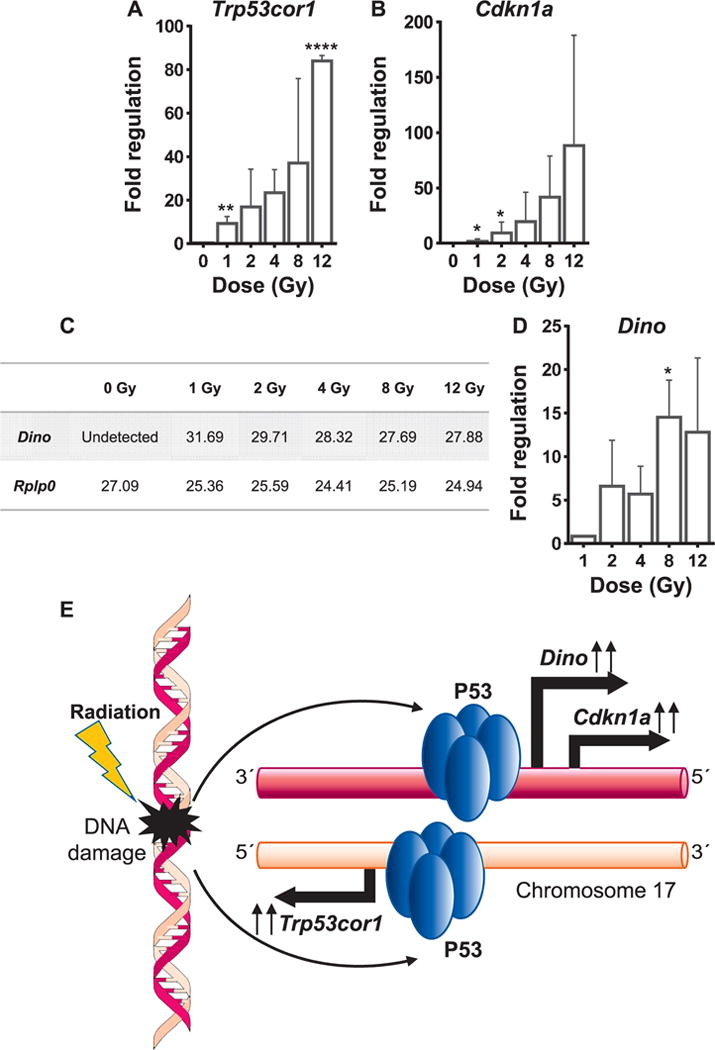
FIG. 4.

Concomitant induction of Trp53cor1, Cdknla and Dino. Panels A and B: qRT-PCR analysis showing fold change in the expression of Trp53cor1 and Cdknla, respectively, at different doses compared to 0 Gy at 48 h postirradiation. Panel C: Table showing mean Ct (threshold cycle number) values of Dino and Rplp0 observed in the qRT-PCR assays performed on the 48 h time point samples. Panel D: qRT-PCR analysis showing fold change values of Dino at various doses compared to 1 Gy at the 48-h time point. Rplp0 was used as the normalizing control. All graphs show mean ± SD from three animals/dose/time point. Statistical significance was calculated using one-way ANOVA, and Dunnett’s test was performed to calculate pair-wise P values of treatment sets compared to the control set. Panel E: Schematic showing concomitant induction of Cdknla, Trp53cor1 and Dino from the mouse chromosome 17 by P53. *P < 0.05, **P < 0.01 and ****P < 0.0001
