Fig. 3.
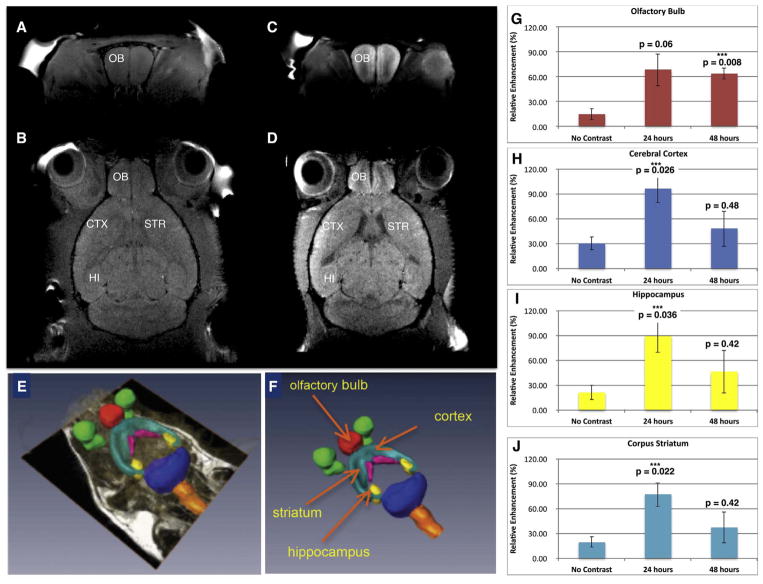
Mn-containing NPs were visualized and tracked by MRI. A) Baseline T1-weighted image of coronal section through olfactory bulb and B) baseline horizontal section showing the anatomical regions of interest. C) T1-weighted MR of mouse 24 h after administration of mNPs showing enhanced Mn signal in coronal section of olfactory bulb, and D) T1-weighted image signal in horizontal section including olfactory bulb, cerebral cortex, striatum and hippocampus. E, F) Parcellation of brain regions (to demarcate brain structures) was performed to quantify Mn signal at 24 and 48 h. G) Olfactory bulb; H) Cerebral Cortex; I) Hippocampus; J) Corpus Striatum. Mean Mn signal (±SEM, n = 3) was increased in all brain regions at 24 and 48 hrs compared to control mice (ie “no contrast”) after intranasal instillation. One-way ANOVA was performed for each brain region using Matlab Statistics Toolbox (Mathworks, Inc.).

