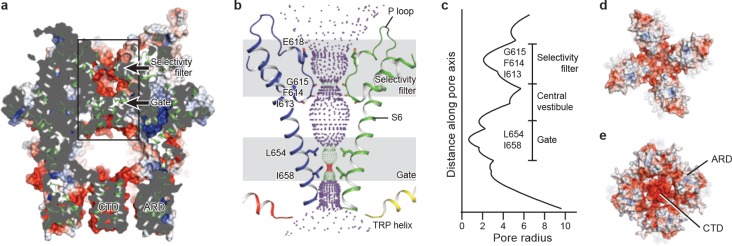
Figure 5. The ion-conducting pore.
(a, d, e) Surface representation of TRPC3, viewed (a) parallel to the membrane, (d) from the extracellular side, and (e) from the intracellular side. The surface is colored according to electrostatic surface potential; the color gradient is from −5 to 5 kT/e (red to blue). The protein is also shown in cartoon representation in (a). (b) The shape and size of the ion-conducting pore (boxed area in panel a). The P loop and S6 of two subunits and the TRP helix of the other two subunits are shown as cartoons, and the side chains of restriction residues are shown as sticks. Purple, green, and red spheres define radii of >2.3, 1.2–2.3, and <1.2 Å, respectively. (c) Plot of pore radius as a function of distance along the pore axis in Angstroms.

