. 2018 May 24;7:e34711. doi: 10.7554/eLife.34711

Figure 6. Distinct and overlapping pattern of residues contribute to the actions of EU1794 modulators with opposing effects.

(A) Ribbon representation (left) of a GluN1/GluN2D model based on published crystal structures of GluN1/GluN2B and GluA2 (Karakas and Furukawa, 2014; Lee et al., 2014; Yelshanskaya et al., 2016). The GluN1 subunits are grey and the GluN2D are purple; surface shell indicate residues of interest in GluN1 and GluN2D, including residues that are homologous to those identified in recent studies investigating transmembrane domain interacting modulators of NMDAR and AMPAR (Yelshanskaya et al., 2016; Wang et al., 2017). These GluN1 and GluN2D residues were changed to alanine (or tyrosine in two cases, as previously reported) and tested for effects on the NMDAR sensitivity to EU1794-2 and EU1794-27. Top down (right top) and side (right bottom) view of the model TMD and linker segments highlight two potential pockets with GluN1 and GluN2 M3 helices in the background. One pocket is primarily associated with GluN1 and the other GluN2. (B) The responses (mean ±99% CI) in EU1794-2 (5 µM, left) and EU1794-27 (10 µM, right) are shown as a % of the mutant receptor response to 100 µM glutamate and 30 µM glycine in the absence of the test compound. The wild type mean response is shown by the dashed line, surrounding dotted lines, which indicate the 99% confidence interval. Residues with non-overlapping confidence intervals with the wild type are colored with magenta indicating apparent loss of activity, yellow indicating augmented activity, and green indicating robust inverted modulation. Data for the mutations shown represent 4–18 oocytes from at least two independent experiments and the wild type response shown represent 83 oocytes for EU1794-2 and 76 oocytes for EU1794-27, recorded each experimental day to ensure consistency. We were not able to test all mutant receptors due to low expression for some (NT, not tested). (C) The residues (shown by the space-filling shell) identified in (B) that altered the effects of EU1794-2 (left) and/or EU1794-27 (right) were mapped onto the model with colors as described in (B). Views are the same as (A), with the all residues probed shown as grey transparent shell representation.

Figure 6.

Figure 6—figure supplement 1. EU1794 series effects are not altered by ATD perturbations.

Figure 6—figure supplement 1.

(A) 10 µM EU1794-27 potentiates GluN2-ΔATD NMDARs (n = 4–12). (B) Concentration-response curves for EU1794-27 potentiation of GluN2B and GluN2D with GluN1-1a and GluN1-1b (with and without exon5, respectively, n = 6–10). * signifies p<0.05 as determined by an unpaired t-test.
Figure 6—figure supplement 2. Compound competition screen of the EU1794 series with NMDAR modulators highlights potential interactions with the ABD and the TMD.

Figure 6—figure supplement 2.

(A) Overlaid surface and ribbon representations of the GluN1/GluN2D model (see Figure 6) highlighting proposed ligand binding sites for ifenprodil (Karakas et al., 2011), PYD-106 (Khatri et al., 2014), CIQ (Ogden and Traynelis, 2013), GNE-6901 (Hackos et al., 2016), TCN-201 (Yi et al., 2016), DQP-1105 (Acker et al., 2011), and QNZ-46 (Hansen and Traynelis, 2011). (B) Single concentration competition experiments are summarized for ifenprodil (0.3 µM, on GluN1/GluN2B, n = 10), CIQ (20 µM, GluN1/GluN2D, n = 15), PYD-106 (100 µM, GluN1/GluN2C, n = 14), TCN-201 (1 µM, 1 µM glycine, GluN1/GluN2A, n = 11), GNE-6901 (30 µM, GluN1/GluN2A, n = 6), GNE-0723 (30 µM, GluN1/GluN2A, n = 6), DQP-1105 (10 µM, GluN1/GluN2D, n = 10), and QNZ-46 (5 µM, GluN1/GluN2D, n = 8) co-administered with maximally effective glutamate and glycine plus either EU1794-2 (3 µM) or EU1794-27 (20 µM). The individual average effects of the pairs of modulators along with the co-applied effect are plotted, and the predicted mean net effect of the modulators is displayed as a dashed line (SEM, dotted lines). * signifies p<0.05 as determined by a paired t-test comparing co-applied modulators and predicted net effect of modulator actions. All pairs were tested during two independent experiments sessions. The predicted net effect was calculated by EffectPredicted-Net = (ResponseDRUG,A / ResponseCONTROL,A) * (ResponseDRUG,B / ResponseCONTROL,B) and displayed as %.
Figure 6—figure supplement 3. Residues in known modulator binding sites do not perturb actions of the EU1794 series.

Figure 6—figure supplement 3.

(A) Inhibition by 5 µM EU1794-2 (left and middle) and potentiation by 10 µM EU1794-27 (right) on NMDARs possessing mutations known to alter the activity of TCN-201 as compared to wild type GluN1/GluN2A (left) and GluN1/GluN2D (middle and right) (Hansen et al., 2012; Yi et al., 2016). (B) Inhibition by 5 µM EU1794-2 (left and middle) and potentiation by 10 µM EU1794-27 (right) on NMDARs possessing mutations that alter the activity of GNE-6901 and GNE-0723 as compared to wild type GluN1/GluN2A (left) and GluN1/GluN2D (middle and right) (Hackos et al., 2016). (C) Inhibition by 5 µM EU1794-2 on NMDARs possessing mutations that alter the activity of PYD-106 as compared to wild type GluN1/GluN2C (Khatri et al., 2014). (D) Inhibition by 5 µM EU1794-2 (left) and potentiation by 10 µM EU1794-27 (right) on NMDARs possessing mutations that alter the activity of DQP-1105 and QNZ-46 as compared to wild type GluN1/GluN2D (Acker et al., 2011; Hansen and Traynelis, 2011). Wild type GluN1/GluN2D data are same as in (A). Data represent recordings from 3 to 9 oocytes. * denotes significance as determined by a one-way ANOVA with Dunnett’s multiple comparison test (compared to control).
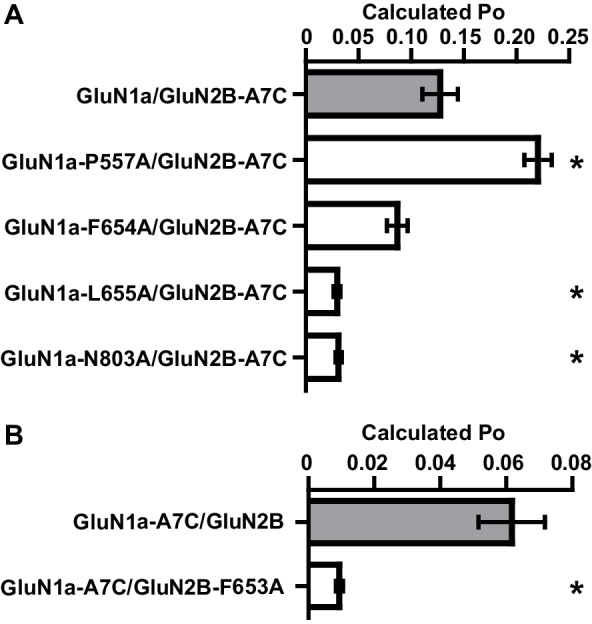
Figure 6—figure supplement 4. Mutated residues that impact EU1794 actions have lower open probability.

Figure 6—figure supplement 4.

(A–B) Calculated open probability (Po) of mutations at residues that were important determinants of EU1794-2 and EU1794-27 action was measured by MTSEA modification of either GluN2-A651C (A7C, (A) or GluN1-A652C (A7C, (B). MTSEA (0.2 mM) effect on steady state responses to saturating concentration of glutamate and glycine was determined after 3 min of application, and a correction factor was used to account for changes in channel conductance (Yuan et al., 2005).