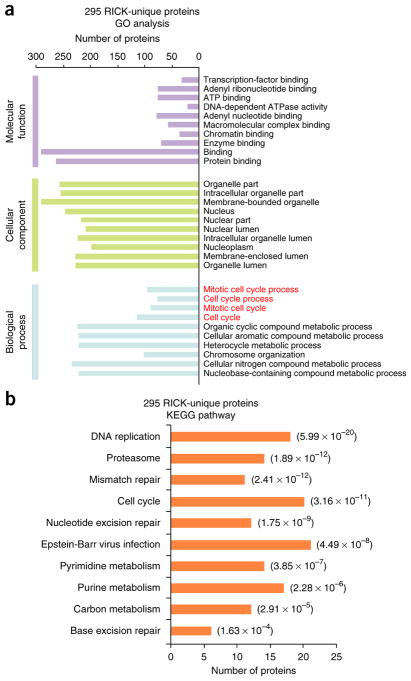
Figure 4.
Functional characterization of novel candidate RBPs identified by RICK. (a) GO analysis of the 295 RICK-unique RBPs; the top ten GO terms with the smallest P value in the indicated categories are shown (Fisher’s exact test, one tailed). The number of proteins for each individual term is also shown. Biological processes related to mitosis are marked in red. (b) KEGG pathway analysis of the 295 RICK-unique RBPs. The number of proteins for each individual pathway is also shown; P value is also shown (Fisher’s exact test, one tailed).

