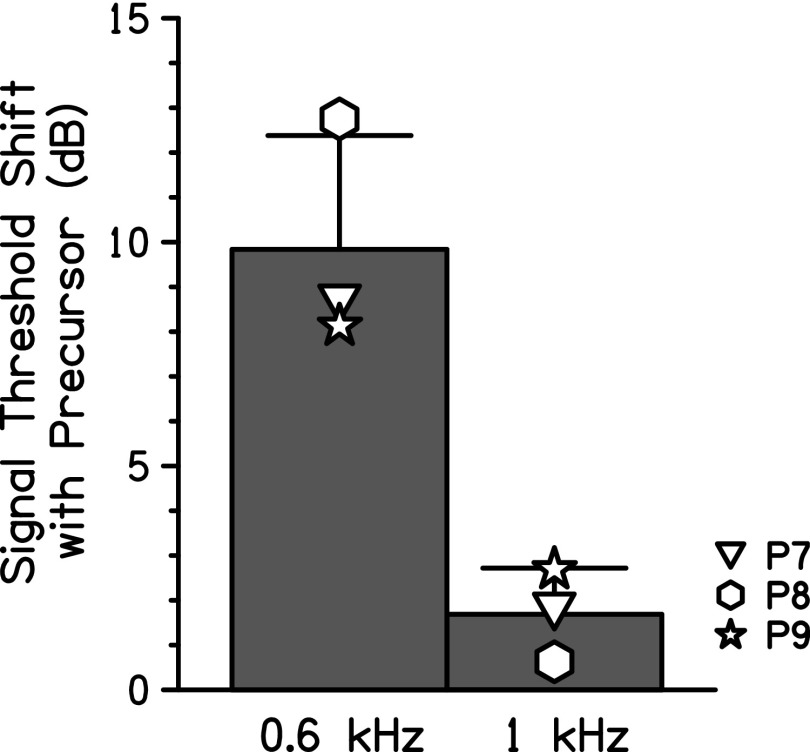
FIG. 5.
Group average difference between the 1-kHz signal thresholds measured when the signal was preceded in time by a masker alone and when the signal was preceded by a precursor and masker. The bar labeled “0.6 kHz” shows the average shift in threshold when a precursor is added to the off-frequency (0.6 kHz) masker condition. The bar labeled “1 kHz” shows the average shift in threshold when a precursor is added to the on-frequency (1 kHz) masker condition. The error bars represent one standard deviation.

