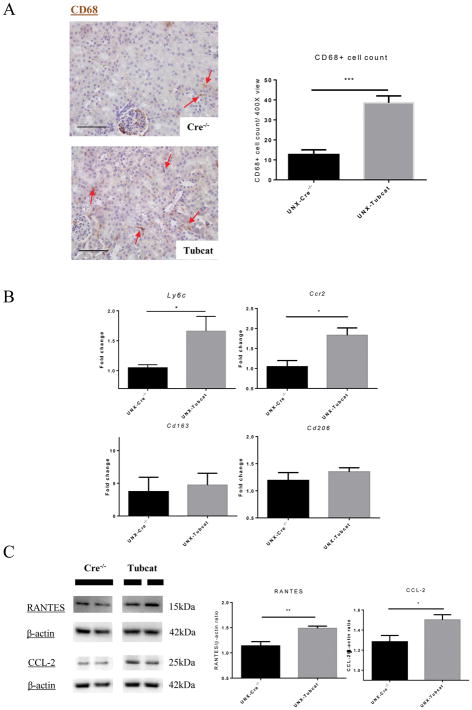
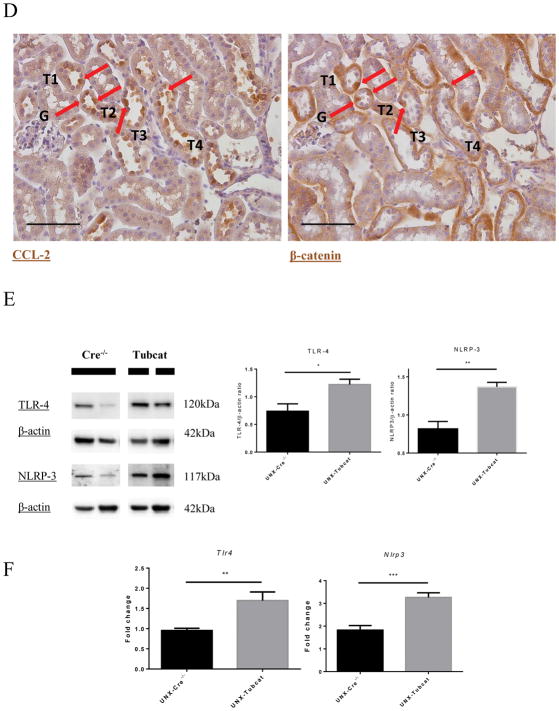
Figure 3. Renal inflammation in uninephrectomized Tubcat mice with enhanced cortical chemocytokine expression.
(A) Immunohistochemical staining of CD68+ cells (red arrows) on kidney tissues. Average CD68+ cell counts on tubulointerstitial area (400X magnification) of Tubcat and Cre−/− mice (n=5). (B) Gene expression of M1 (Ly6c and Ccr2) and M2 (Cd163 and Cd206) macrophage markers in renal cortices of Tubcat and Cre−/− mice (n=5) 4 weeks after tamoxifen administration by qPCR. Renal cortical expression of (C) RANTES, CCL-2, and (E) TLR-4 and NLRP-3 in experimental mice by immunoblottings (n=5). (D) Immunohistochemistry staining of CCL-2 and β-catenin on serial kidney sections from a Tubcat mouse by using different primary antibodies as annotated. Red arrows indicate the colocalization of CCL-2 and β-catenin detected in the same tubular cells. Bar scale = 250 μm. (F) Gene expression of TLR-4 and NLRP-3 by qPCR (n=5). Results were expressed as means ± SEM. A two-sided t-test was used for comparison. *p<0.05, **p< 0.01, ***p<0.0001


