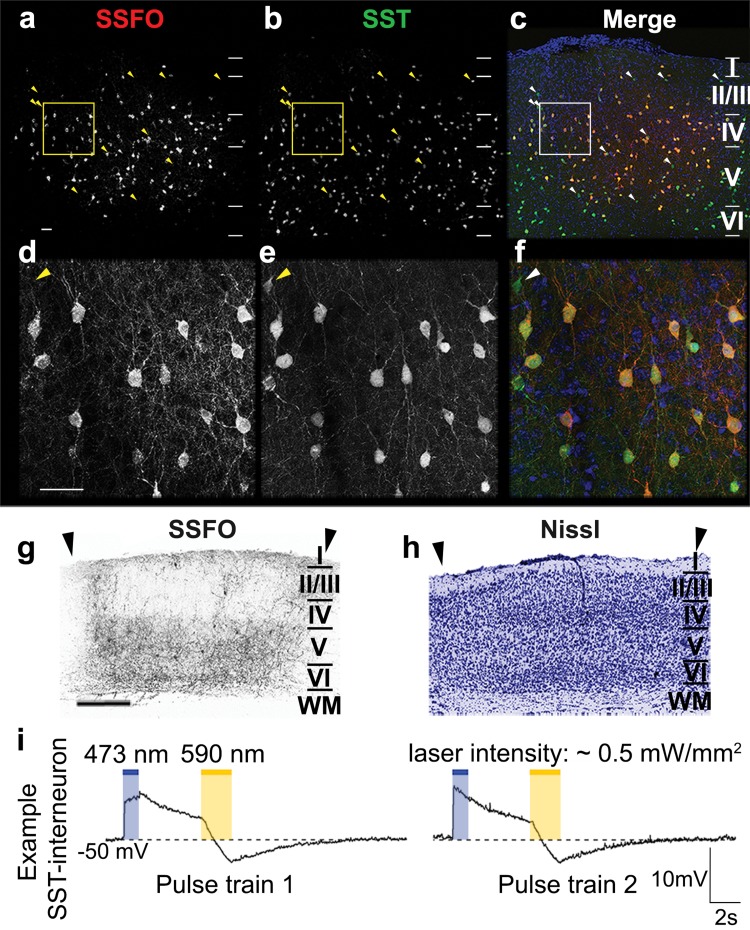
Fig. 2.
Expression pattern and functionality of SSFOs in SST-interneurons following viral vector transduction. Injection site in V1 on a coronal section illustrating SSFO-transduced neurons (a), eYFP-positive SST-interneurons (b) and an overlap between SSFO-positive neurons in red, eYFP-positive SST-interneurons in green and a DAPI counterstain in blue (c). Horizontal lines demarcate the laminar borders within the neocortex. Higher magnification details from the yellow and white rectangular regions in a–c. SSFO-positive neurons (d) and eYFP-positive SST-interneurons (e) are overlapped in red and green, respectively, with a blue DAPI counterstain (f). Yellow or white arrowheads indicate eYFP-positive SST-interneurons that do not express SSFO. Scale bars = 100 µm. Detail of the laminar SSFO-expression pattern at bregma level − 3.40 mm of a Stim-7wME animal (g) and its adjacent Nissl-stained cryosection (h) illustrate normal histology despite long term implantation of the head posts. Arrowheads delineate V1. Scale bar = 500 µm. i Example recordings from a SST-interneuron illustrate the responses of its membrane potential following light stimulation. A 1-s blue (473 nm) light pulse (intensity ~ 0.5 mW/mm2) increased the membrane potential to − 40 V, which then gradually decayed. A subsequent yellow (590 nm) light pulse (intensity ~ 0.5 mW/mm2) allowed the cell to return to the prestimulation baseline level as SSFO-channels close. Two consecutive stimulations within the same SST-interneuron are shown

