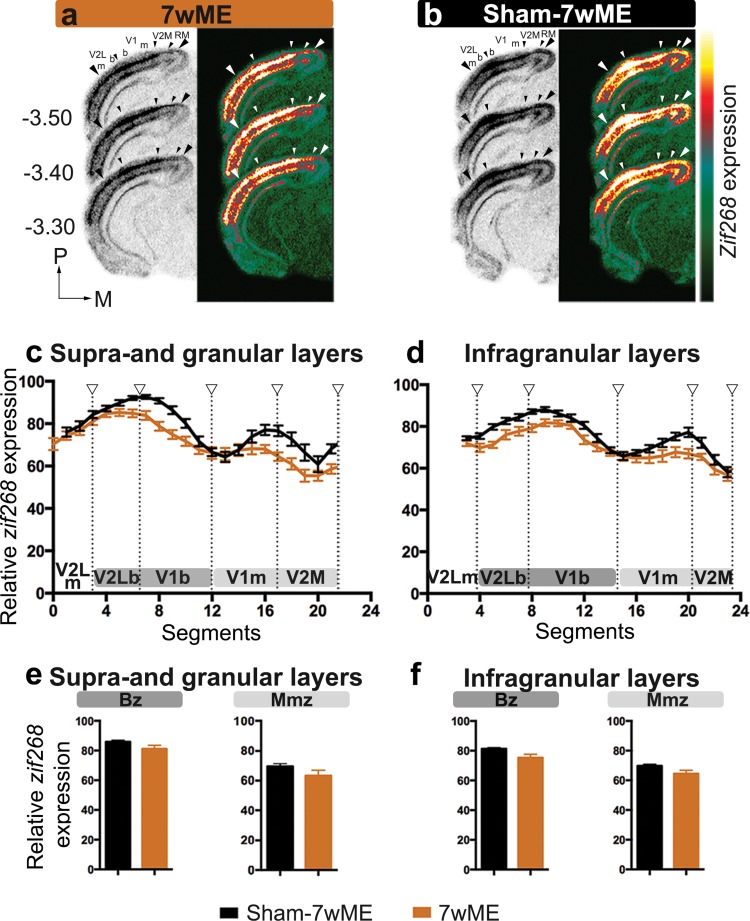
Fig. 3.
The effect of sham surgery on the recovery pattern following 7wME in the deprived visual cortex. Images of three adjacent zif268-mRNA labeled coronal cryosections surrounding bregma level − 3.40 mm of normal 7wME mice (a) and sham-7wME mice (b) show a similar reactivation profile. The corresponding pseudocolor representations of signal intensity differences are displayed next to their respective ISH sections. Scale bar = 2 mm. Line graphs illustrating the relative zif268-mRNA expression level measured as the average OD-value per segment for sham-7wME mice (black line) and normal 7wME mice (orange line). For supra- and granular layers II/III and IV (c) and infragranular layers V and VI (d) the expression levels are displayed along the five predefined visual subdivisions (hollow arrowheads are in accordance with the small arrowheads in a and b, including the subdivision between monocular zones m and binocular zones b). Error bars represent the SEM of the mean OD in each segment. Relative zif268-mRNA expression levels are shown as OD-values averaged over the binocular zone Bz and the medial monocular zone Mmz for supra- and granular layers (e) and infragranular layers (f). Bz corresponds to V2Lb combined with V1b (dark grey marking), Mmz corresponds to V1m combined with V2M (light grey marking) as illustrated in c and d. Error bars are SEM. Comparison of black bar graphs representing the OD-values of sham-7wME mice to orange bar graphs of normal 7wME mice indicated no differences between the two conditions in either layer or zone (sham-7wME, upper layers, Bz: average ± SEM; 85.87 ± 0.99; Mmz: 69.48 ± 1.90; lower layers, Bz: 81.29 ± 0.76; Mmz: 69.72 ± 1.09; 7wME, upper layers, Bz: 81.16 ± 2.34; Mmz: 63.53 ± 3.47; lower layers, Bz: 75.26 ± 2.34; Mmz: 64.47 ± 2.34)

