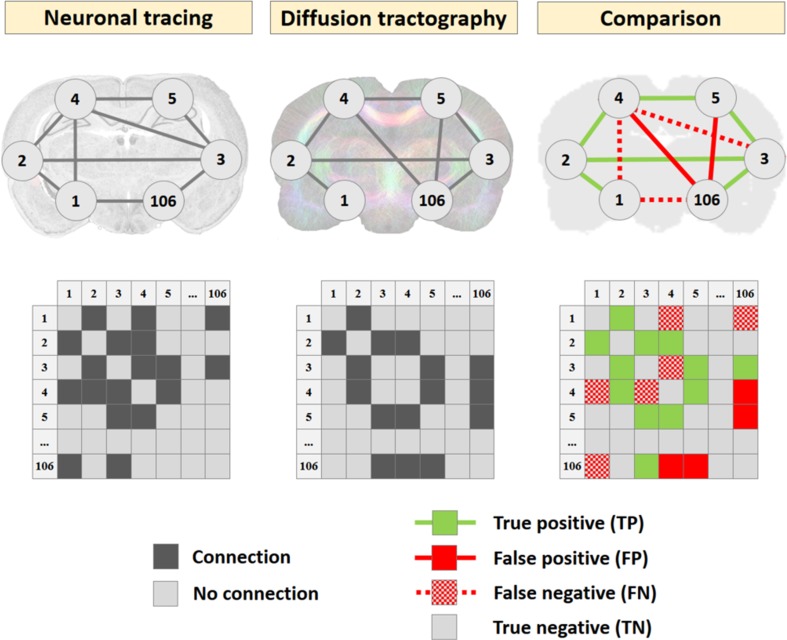
Fig. 1.
Comparison of connectivity networks from neuronal tracer database and diffusion tractography algorithms. Neuronal tracer-based (left column) and diffusion tractography-based (middle column) connectivity networks represented as network graphs (top), in which nodes represent cortical atlas regions (N = 106) and edges represent connections, and as adjacency matrix (bottom), in which rows and columns represent cortical regions and dark squares represent connections. Diffusion tractography-based connectivity networks were compared against the neuronal tracer-based network as ground truth, which yielded true positives (green lines and squares), false positives (red lines and squares), false negatives (dotted red lines and squares), and true negatives (no line and color-coding) (right column).

