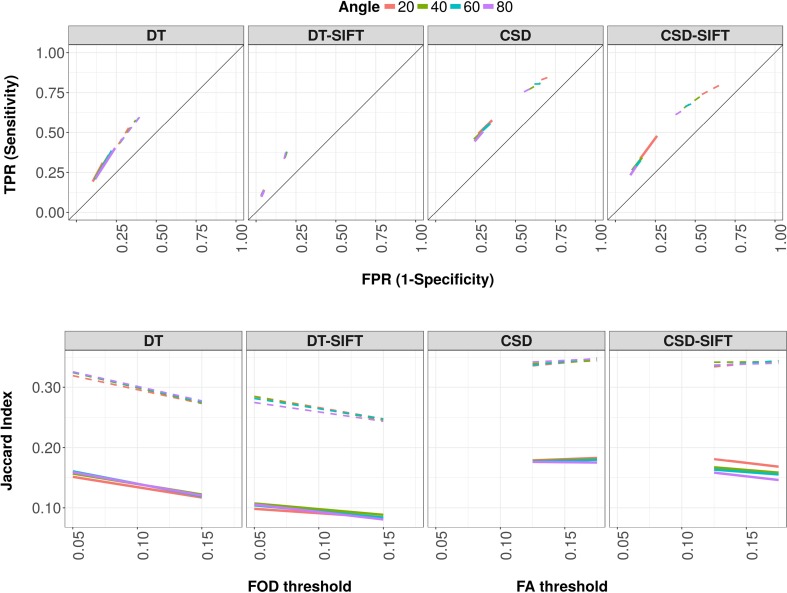
Fig. 4.
Connectome reconstruction sensitivity, specificity and Jaccard index of DT-based and CSD-based tractography, with and without SIFT correction. Reconstruction sensitivity (true positive rate; TPR) versus 1-specificity (false positive rate; FPR) (top) and Jaccard index (bottom) over FA thresholds (DT and DT-SIFT) and over FOD thresholds (CSD and CSD-SIFT) for different angle thresholds (line color) with default step size and 250,000 streamlines. All parameters are plotted for interhemispheric (solid lines) and intrahemispheric (dashed lines) connections separately

