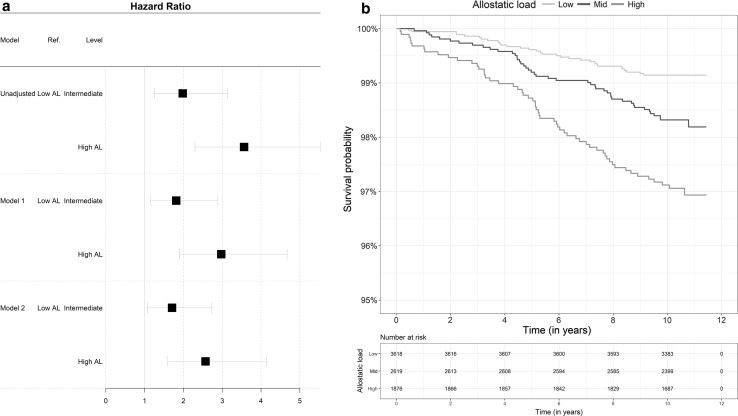
Fig. 1.
a Forest plot of hazard ratio for all-cause of mortality associated with the AL and b Kaplan–Meier curve of the Survival probability over the 11 years follow-up period according to category of the allostatic load (N = 8,113, 132 deaths). Allostatic load was classified as low, intermediate, or high as described in Table 2

