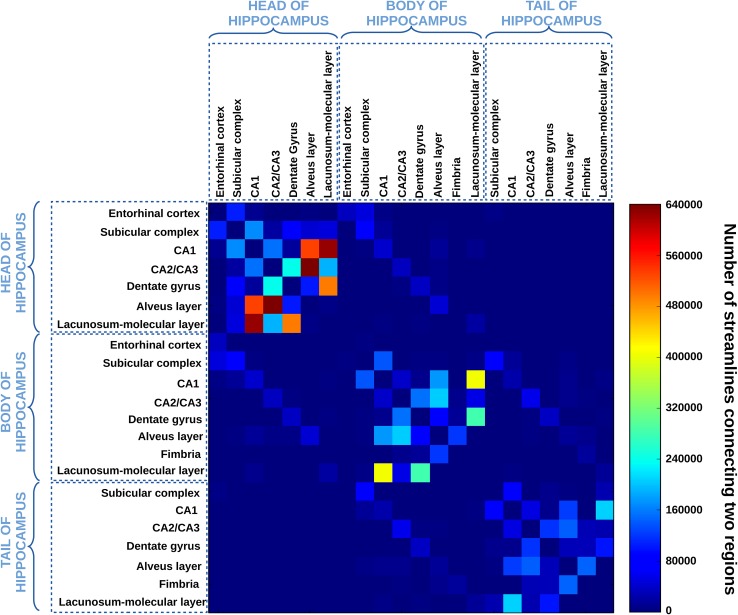
Fig. 7.
Connectivity matrix of the hippocampal substructures obtained with the probabilistic model. Each matrix element represents the number of fibers connecting the ROIs indicated by the column and by the row. Self-connections are excluded, which implies a zero diagonal line in the matrix. The map is symmetric, because efferent and afferent projections cannot be distinguished with diffusion MRI. The heat scale represents the number of fibers connecting the ROIs

