Figure 6.
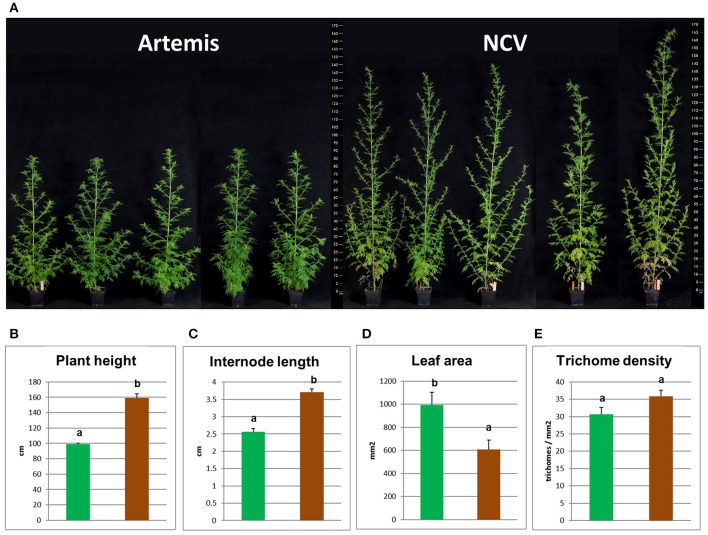
Morphological characterization of low- and high-artemisinin natural chemotypes of A. annua. (A) Photographs show four representative 12-week old plants from each two chemotypes of A. annua, ruler scaled in cm showed on both sides; Plant height (B), internode length (C), leaf area (D), and glandular secretory trichome density (E) recorded for 12-week old plants. Green bars represent Artemis (HAP-chemotype) and brown bars represent NCV (LAP-chemotype). Error bars—SEM (n = 15), letters represent one-way ANOVA Tukey's range test results; Groups not sharing letters indicate statistically significant differences.

