Figure 1.
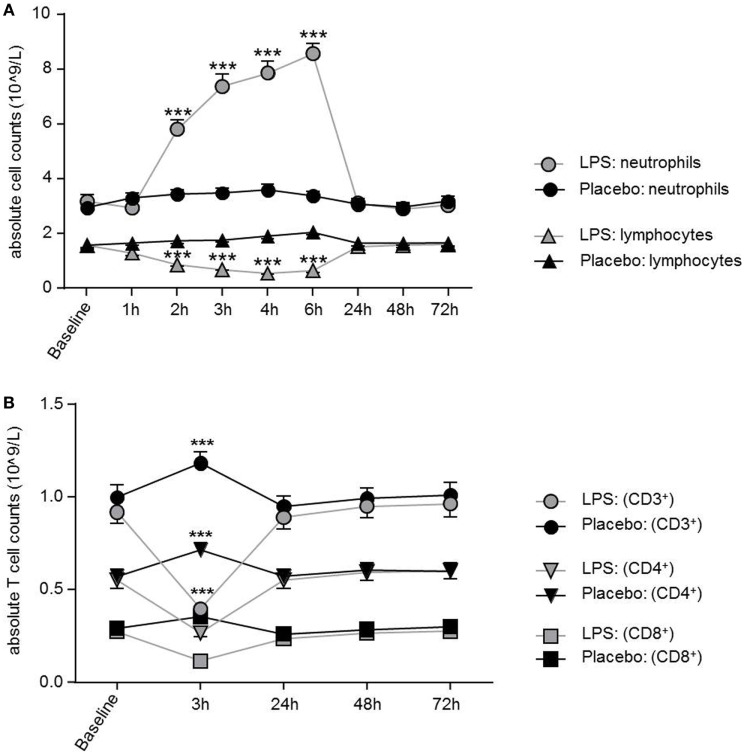
Dynamics of neutrophils, lymphocytes, and T-cells over time after lipopolysaccharide (LPS) challenge. (A) Neutrophils were significantly increased between 2 and 6 h after LPS application and normalized after 24 h, while lymphocytes showed a significant decrease between 2 and 6 h. Neutrophil and lymphocyte counts remained unchanged in the placebo condition. (B) After 3 h of LPS injection, all T-cell subsets showed a significant decrease of absolute T-cells counts with normalization after 24 h. In the placebo condition, T-cell subset counts were increased 3 h after placebo injection as compared to baseline, following the circadian rhythm (nadir of naïve CD4+T-cells/naïve CD8+ cytotoxic T-cells at 11:00 a.m., peak of naïve CD4+ T-cells/CD8+ T-cells around 2:00 a.m.) Data are given as mean (±SEM). Two-way ANOVA analysis with repeated measures was performed followed by post hoc Bonferroni-corrected paired t-tests. *p < 0.05, **p < 0.01, ***p < 0.001, results of post hoc Bonferroni-corrected t-test. For results of ANOVA see text.

