Figure 4.
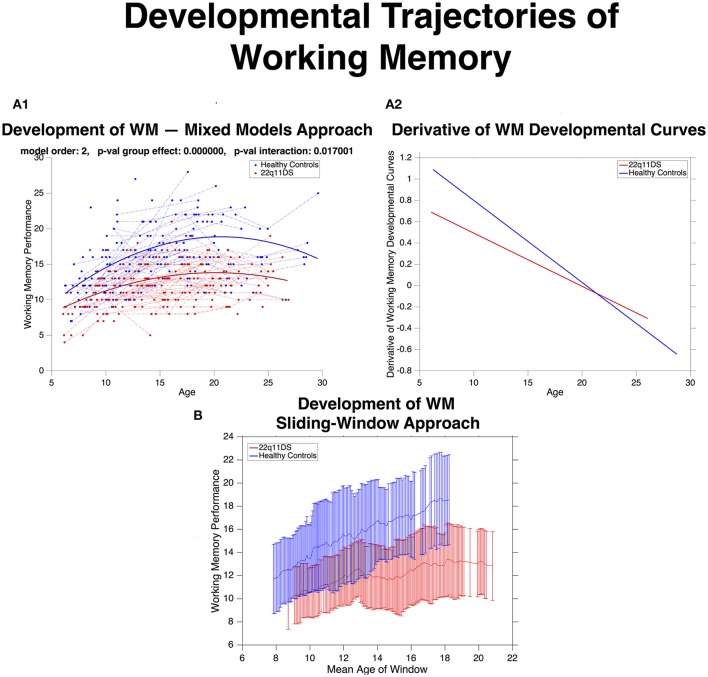
(A.1) Developmental trajectories of working memory (WM) described using mixed-model linear regression for HCs in blue and 22q11DS in red. WM is on average lower in 22q11DS (p-val group effect < 0.0001) and undergoes aberrant development with age (p-val interaction = 0.01). (A.2) Derivatives of WM developmental curves, express mean rate of WM maturation as a function of age for HCs in blue and 22q11DS in red. Strongest differences in rate of WM development are observable at the youngest ages, during late-childhood and early adolescence while by late adolescence rate WM maturation is similar between the two populations. (B) Developmental trajectories WM are estimated using the same sliding-window approach used to compute structural covariance. Error-bars (HCs in blue and 22q11DS in red) indicate mean ± standard deviation of WM scores in each window.

