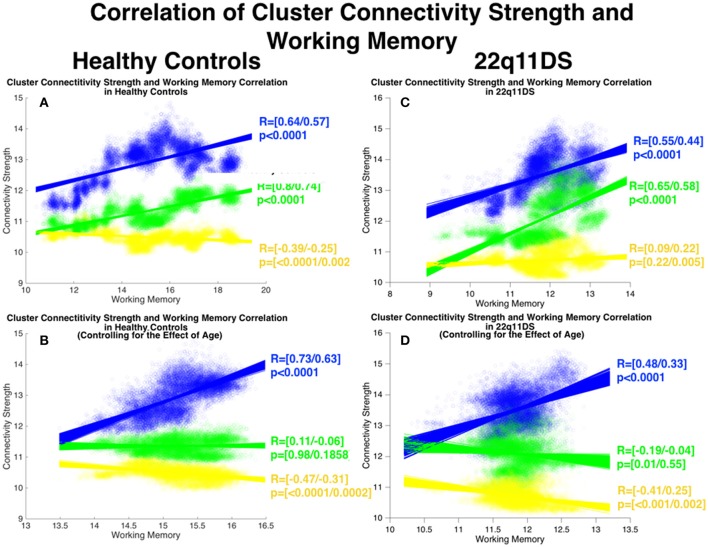
Figure 6.
Correlation between structural covariance local connectivity strength and working memory. Method: Mean connectivity strength in each cluster and mean WM scores are computed in each window and are correlated using Pearson's correlation. The process is repeated for 900 BSs in each window to define confidence intervals of correlations. Correlations are furthermore repeated after controlling for the effect of age. (A) Correlations in HCs before controlling for age. (B) Correlations in HCs after controlling for age. (C) Correlations in 22q11DS before controlling for age. (D) Correlations in 22q11DS after controlling for age.

