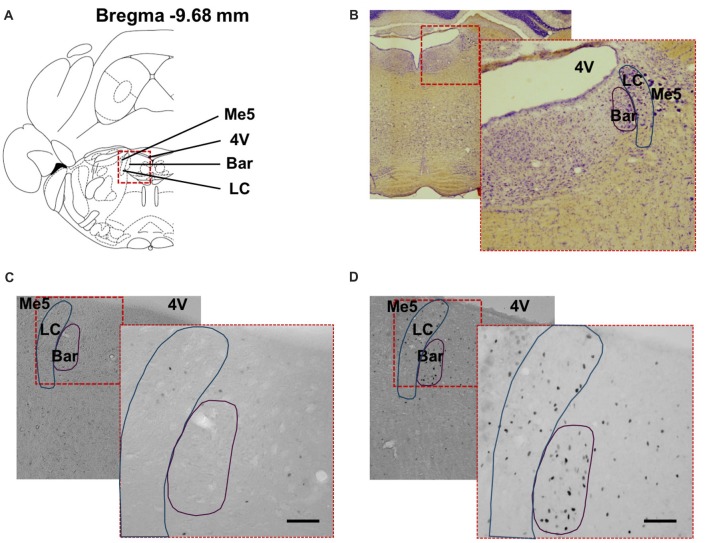
Figure 7.
Distribution of cFos immunoreactive cells in the pontine structures. (A) Coronal diagram of the rat brain at corresponding Bregma level AP −9.68 mm (Rat brain atlas, Paxinos and Watson, 2007). Representative low power photomicrographs of coronal brain sections stained (B) with Nissl staining and for cFos showing the dorsal pons of (C) non-stimulated (Sham) rat and (D) stimulated rat (Stim) with bipolar stimulation electrode implanted in the bladder wall at the dome and neck levels. The higher power photomicrographs in the lower right corners show the PMC and locus coeruleus. 4V, fourth ventricle; PMC, Pontine micturition center or Barrington’s nucleus; LC, locus coeruleus; Me5, mesencephalic trigeminal tract. Scale bar = 150 μm.

