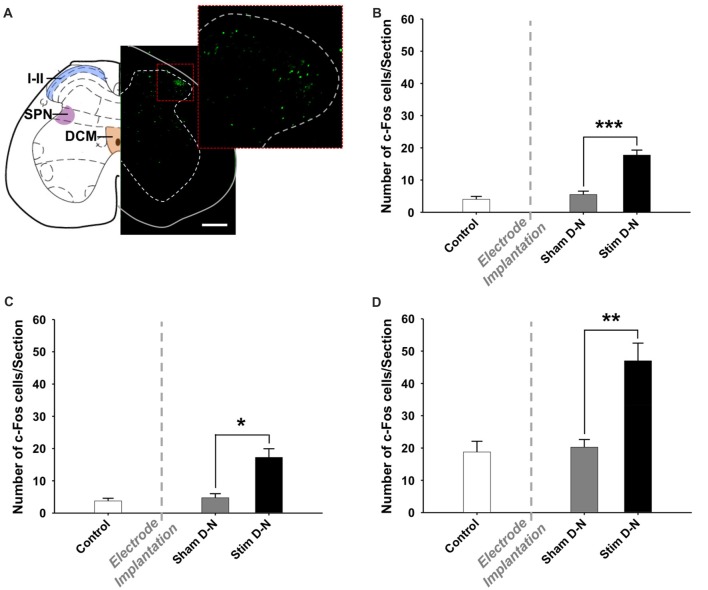
Figure 8.
Expression of cFos immunoreactive cells in the lumbosacral spinal cord. (A) Coronal diagram of the rat lumbosacral spinal cord (L6) showing the location of the dorsal horn (i.e., laminae I and II), the sacral parasympathetic nucleus and the dorsal commissure (Rat brain atlas, Paxinos and Watson, 2007) and a corresponding photomicrograph showing a spinal cord section stained for cFos of stimulated rat with bipolar stimulation electrode implanted in the bladder wall in the D-N configuration. The higher power photomicrograph in the right corner shows the dorsal horn of the spinal cord. Abbreviations: I–II: laminae I and II, DCM: dorsal commissure, SPN: sacral parasympathetic nucleus. Scale bar = 200 μm. Cumulative data showing the means and SEM for the optical density of cFos expression for D-N group in the (B) SPN, (C) DCM and (D) I–II of L6-S2 spinal cord. Control n = 4, Sham D-N n = 4 and Stim D-N n = 4. t-test, *p < 0.05, **p < 0.005 and ***p < 0.001.

