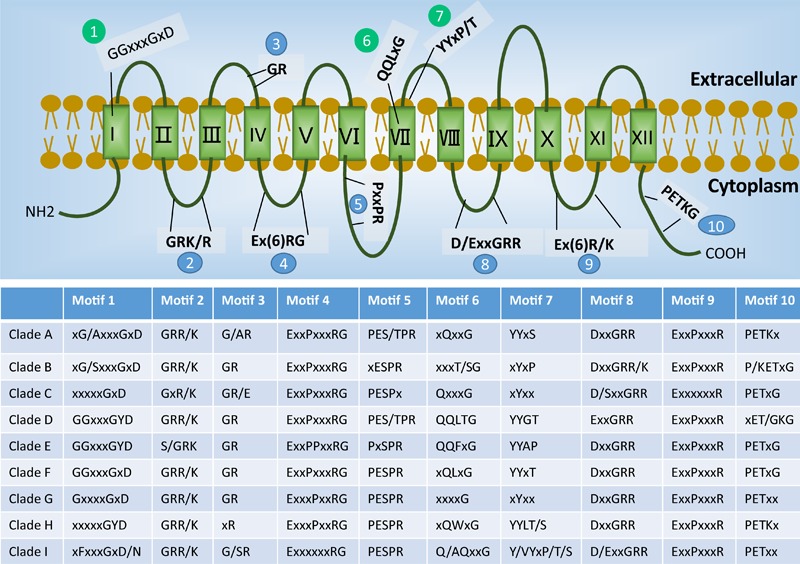
FIGURE 2.

Sugar transporter signatures present in each phylogenetic clade (see Figure 1). The overall distribution of well-documented motifs is shown on the top of the schematic figure, where blue color indicates the conserved structure signatures and green color indicates the known sugar binding motifs. The table at the bottom shows the conservation and variations of the motifs found in each clade, where the “/” indicates an alternative amino acid and “x” indicates a non-specific amino acid.
