
Figure 1.
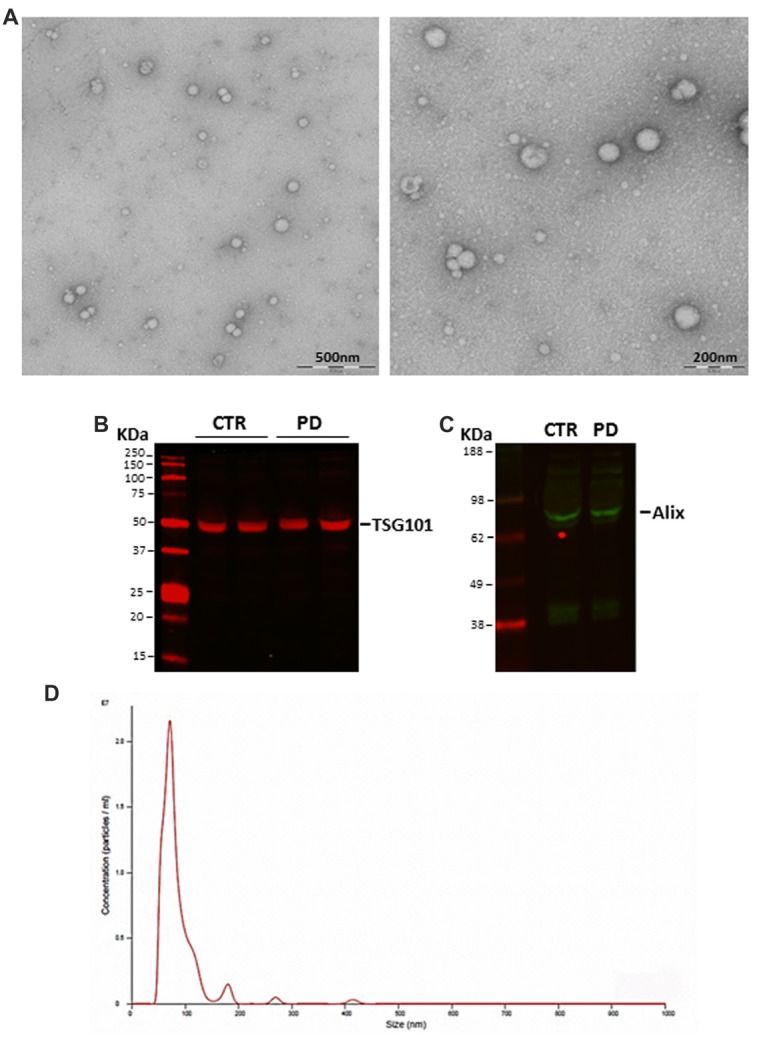
(A) Representative transmission electron microscopy (TEM) images of isolated exosomes. Scale bar: 200 and 500 nm. (B) TSG101 and (C) Alix expression in blood-derived exosomes as evaluated with Western blot. (D) Size distribution and concentration of isolated exosomes evaluated by NanoSight (CTR, controls; PD, Parkinson’s disease patients).