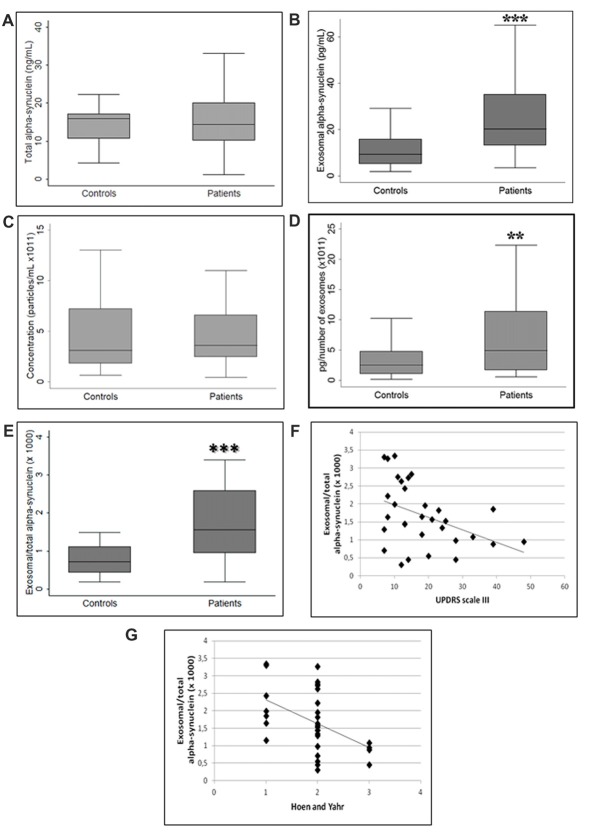
Figure 2.
Comparison between (A) total alpha-synuclein (α-syn), (B) exosomal α-syn, (C) exosome concentration, ratio of exosome-associated α-syn to (D) exosome concentration and (E) total α-syn in controls and PD patients. (F,G) Exosomal/total α-syn ratio and disease severity correlation. **p < 0.01, ***p < 0.001 Student’s t-test.

