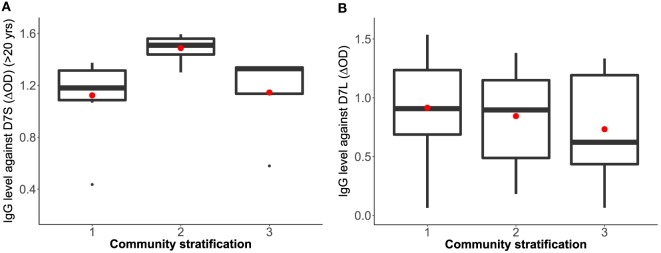
Figure 3.
Correlation analysis between Aedes aegypti D7 short (A) and D7 long (B) salivary proteins and living conditions represented as socioeconomic stratification. Stratum 1: lower-low conditions (D7S n = 8, D7L n = 23), stratum 2: low conditions (D7S n = 8, D7L n = 26), and stratum 3: upper-low conditions (D7S n = 4, D7L n = 12). Notice that D7S graphic excludes participants under 20 years old in the analysis.

