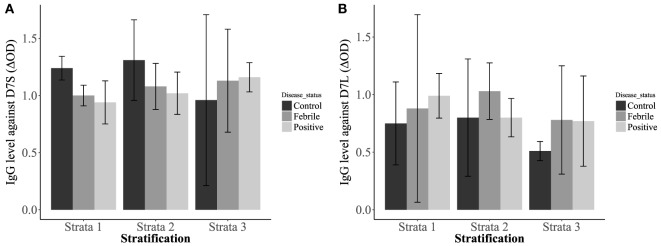
Figure 4.
Interaction plots showing the concentrations of IgG antibodies against D7 short (A) and D7 long (B) when evaluated against the patient disease status: non-febrile subjects (control) (n = 12), febrile subjects (n = 12), and dengue virus positive subjects (n = 37) and living conditions [stratum 1: lower-low conditions (n = 23), stratum 2: low conditions (n = 26), and stratum 3: upper-low conditions (n = 12)].

