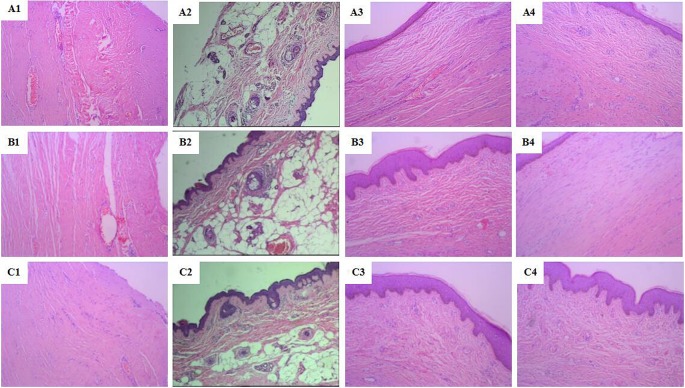
Figure 2. Histological characteristics of wound healing at each time point in each group (H&E staining, ×100).
(A1), (B1), and (C1): the third day after modeling; (A2), (B2), and (C2): the 7th day after modeling; (A3), (B3), and (C3): the 11th day after modeling; (A4), (B4), and (C4): the 15th day after modeling; (A1–A4): the control group; (B1–B4): the JWH group; (C1–C4): the EE group.

