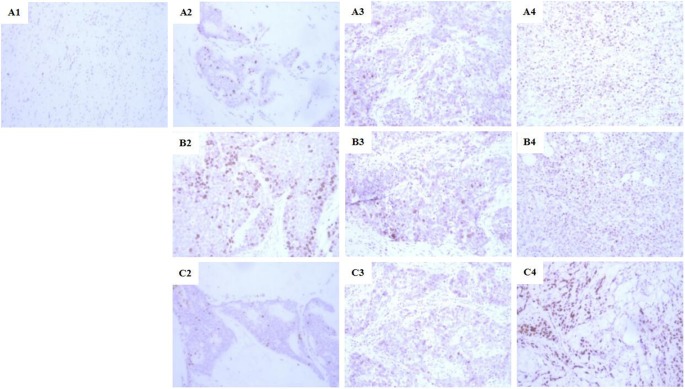
Figure 3. Ki67 protein expression at different grades in each group (×400).
(A1): negative expression (−); (A2), (B2), and (C2): weak positive expression (+); (A3), (B3), and (C3): middle positive expression (++); (A4), (B4), and (C4): strong positive expression (+++); (A1–A4): the control group; (B2–B4): the JWH group; (C2–C4): the EE group.

