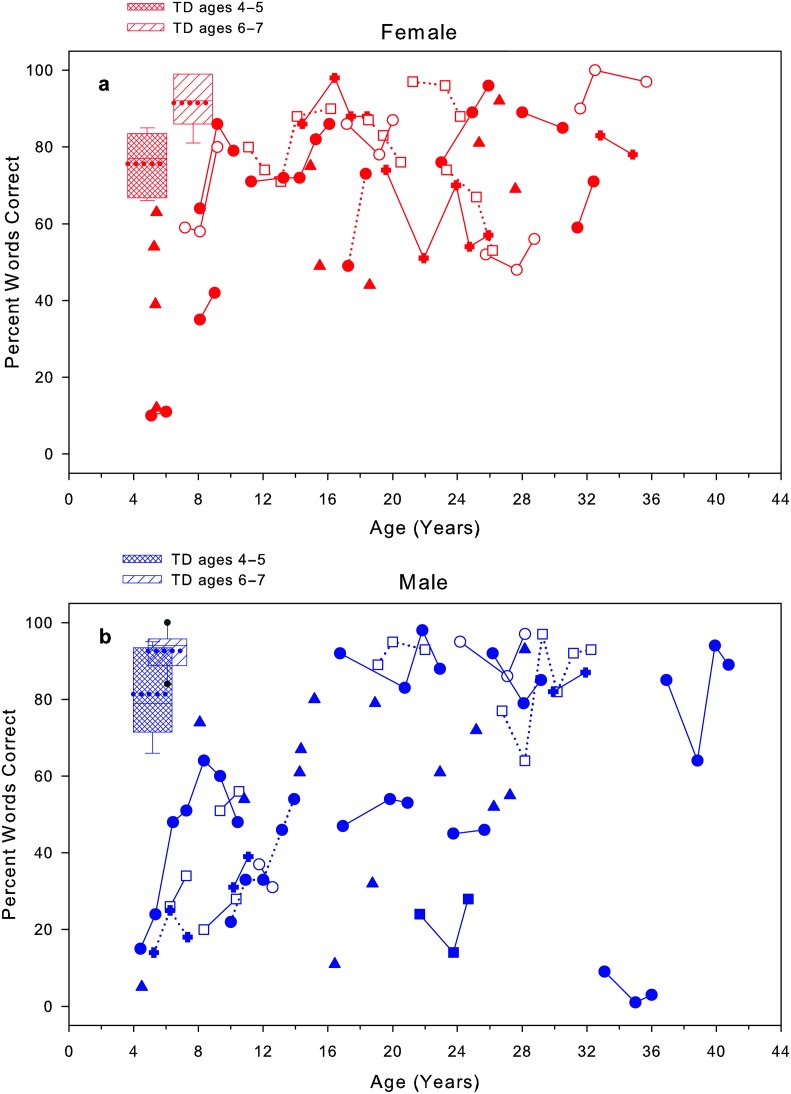
Figure 2.
(a–b) Words correct for all speakers, with female individuals shown in red and male individuals in blue. Data from TD speakers are represented by box and whisker plots. The box plots show the 25th and 75th percentiles, with a dotted line representing the mean and a solid line representing the median. The whiskers show the 10th and 90th percentiles, and outlying data are shown as dots. Data from persons with DS are shown by scatter plots. Speakers with only one speech recording are represented by triangles, and speakers with multiple speech recordings are denoted by different symbols (squares, circles, and cross) connected by dotted or solid lines. DS = Down syndrome; TD = typically developing.

