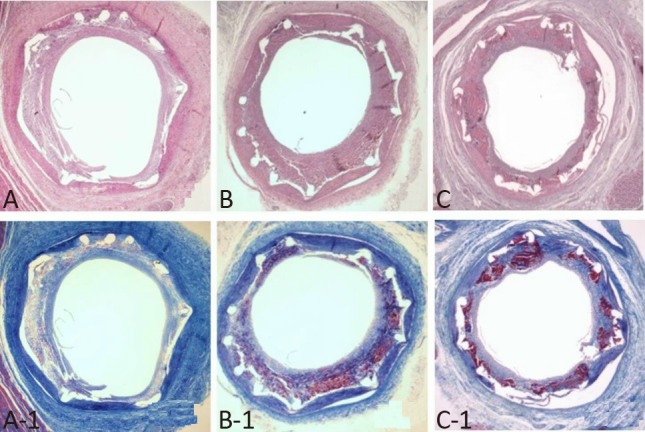
Figure 4.

Representative images of hematoxylin and eosin staining at 4 weeks after stenting. Specimens of implanted GES (A, ×20), GSES (B, ×20), and SES (C, ×20). Carstairs’ fibrin stain (magnitude, ×20) of fibrin infiltration in implanted GES (A-1, ×20), GSES (B-1, ×20), and SES (C-1, ×20). GES, gallic acid-eluting stent; GSES, gallic acid and sirolimus-eluting stent; SES, sirolimus-eluting stent.
