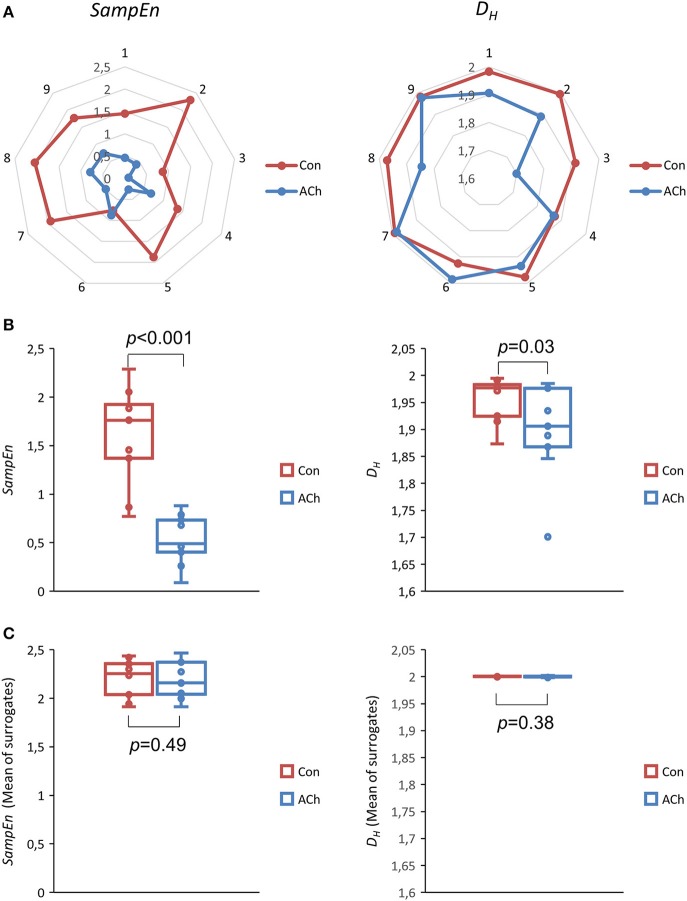
Figure 10.
Sample entropy SampEn (left column) and Higuchi dimension DH (right column) of relative contraction strengths rCSs. Data from optical recordings. The control group is depicted in red and the ACh treated group in blue. (A) Net plots of all experiments, showing individual and pairwise values. (B) Box plots of all experiments. The differences in SampEn and DH are statistically significant, p < 0.001, df = 8 and p = 0.03, df = 8 respectively, median test. (C) Mean SampEn and DH values of shuffled (50x) data series.

