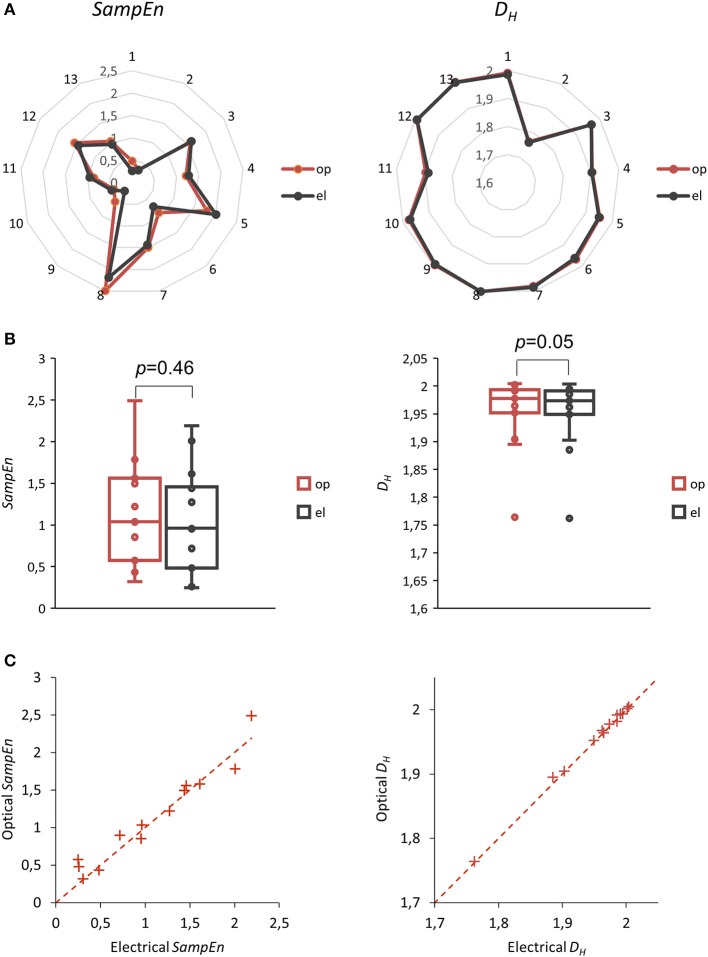
Figure 5.
Sample entropy SampEn (left column) and Higuchi dimension DH (right column) of beat to beat intervals BBIs determined optically and electrically. (A) Net plots showing 13 SampEn and DH values for BBIs. (B) Box plots of these 13 experiments, p-values with df = 12, median test. (C) Scatterplots of these 13 experiments. Dashed lines represent theoretical correlations with the slope of one.

