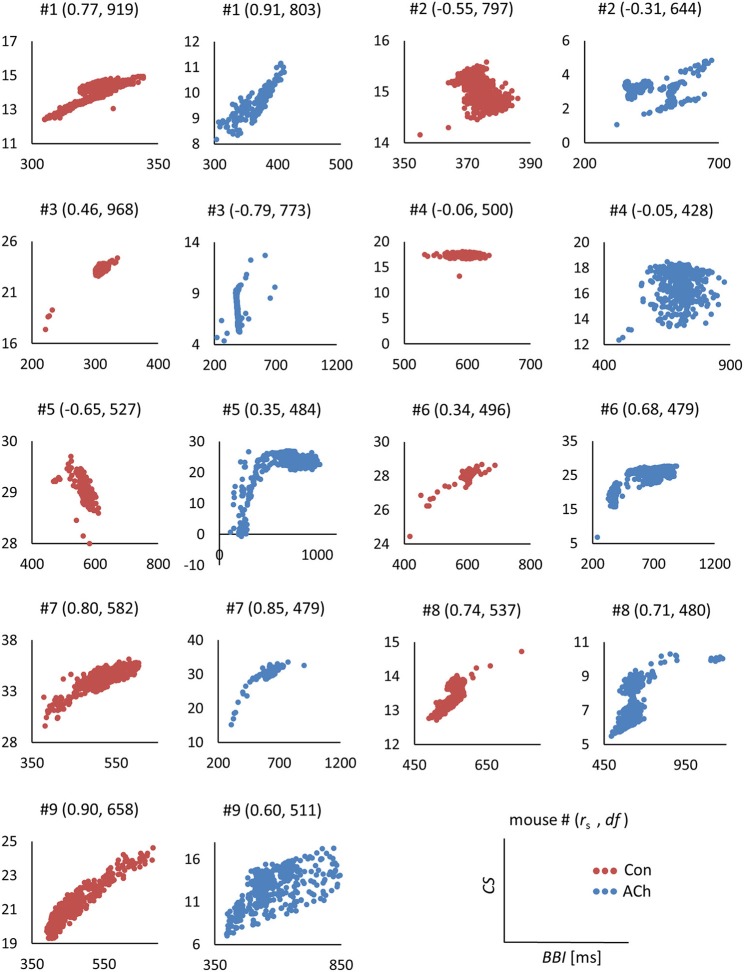
Figure 6.
Scatterplots of contraction strengths CSs vs. beat to beat intervals BBIs in milliseconds. Data from optical recordings. Red dots correspond to control tissue, blue dots to ACh treated tissue. For each individual plot the experiment (mouse) number #, in brackets the actual Spearman's rank correlation coefficient rs and the degrees of freedom df are depicted.

