Table 1.
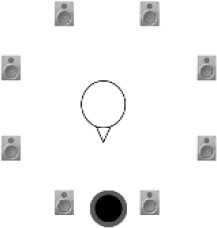
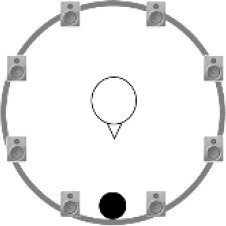
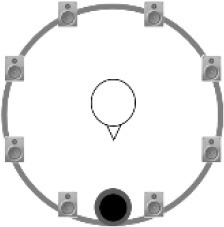
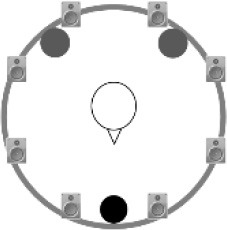
Results of the post-hoc paired comparisons (Wilcoxon-Test) for all listeners and each condition (rows 2–5) and results of the group comparison (Mann–Whitney-U-Test) exploring the differences between NH and HI groups for each listening condition; significant effects are labeled with an asterisk (*) as referred to the Bonferroni-corrected significance levels.
| Condition A | Condition B | Condition C | Condition D | Condition E | |
|---|---|---|---|---|---|
 |
 |
 |
 |
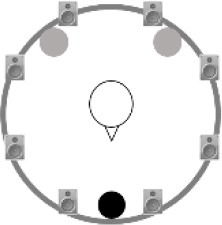 |
|
| Condition A | NA | T = −5.34, p < 0.0001* | T = −5.52, p < 0.0001* | T = −5.48, p < 0.0001* | T = −5.02, p < 0.0001* |
| Condition B | NA | NA | T = −3.40, p = 0.001* | T = −0.98, p = 0.328 | T = −3.52, p = 0.0004* |
| Condition C | NA | NA | NA | T = −3.76, p = 0.0002* | T = −5.05, p < 0.0001* |
| Condition D | NA | NA | NA | NA | T = −0.53, p = 0.011 |
| NH vs. HI | U = 37.5, z = −4.50, p < 0.0001*, r = −0.70 | U = 21.0, z = −4.93, p < 0.0001*, r = −0.77 | U = 48.0, z = −4.23, p < 0.0001*, r = −0.66 | U = 43.5, z = −4.34, p < 0.0001*, r = −0.68 | U = 25.5, z = −4.81, p < 0.0001*, r = −0.75 |
