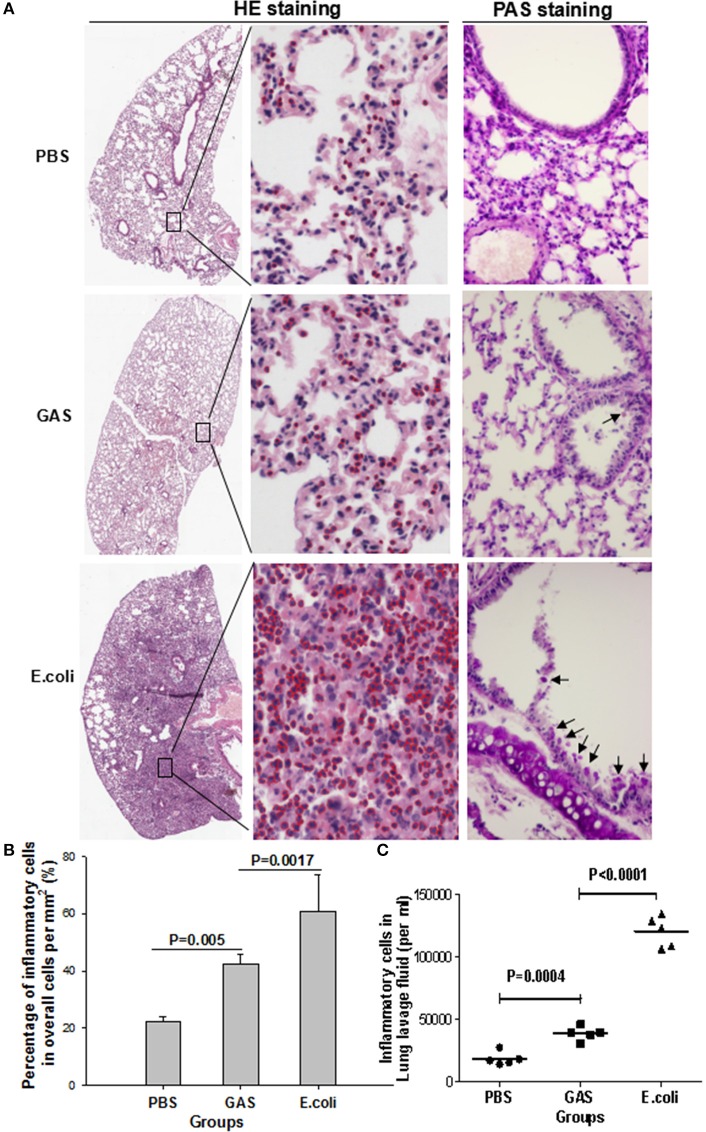
Figure 2.
Histological evaluation of inflammatory response in mouse lung tissue following GAS or E. coli infection. The three experimental groups of mice were separately prepared for histopathological analysis. (A) Representative views of lung sections treated with PBS, GAS, or E. coli. In the left panels, H&E staining shows the overall outline of lung slices, with a magnified image. Inflammatory cells are identified by red circles in the middle panels (H&E staining, × 10 and ×40). Periodic acid–Schiff (PAS) staining showed bronchiolar mucus production in each group (right panels, objective ×20). (B) Quantitative analysis of recruited inflammatory cells per square mm. (C) Inflammatory cells were counted in lung lavage fluid (per ml). Each experiment was repeated three times, and similar results were obtained on each occasion.

