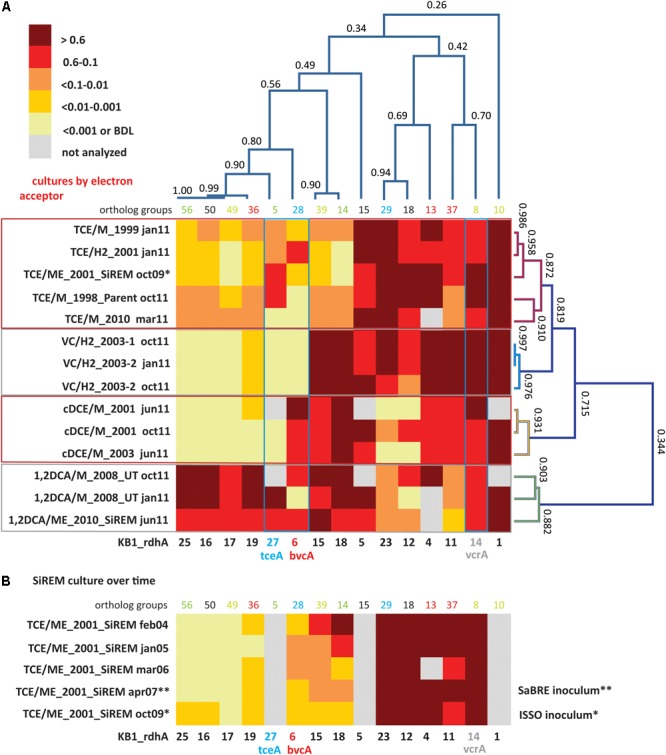
FIGURE 2.

Cluster analysis and heatmaps showing D. mccartyi rdhA/16S rRNA gene copy ratios measured in KB-1 enrichment cultures. (A) Shows how data clustered by the chlorinated electron acceptor amended to individual enrichment cultures as well as by rdhA sequence. The name format indicates electron acceptor amended/donor used_year created, followed by date sampled (e.g., TCE/M_1999 jan11 is a TCE and methanol enrichment culture first established in 1999 and sampled in January of 2011). The numbers on the cluster branches of both axes indicate the percentage similarity between samples based on the Pearson’s correlation coefficient. (B) It is a heatmap of rdhA/16S rRNA gene copy ratios in the SiREM KB-1 culture over 5 years. Cultures indicated with ∗ or ∗∗ are those used for bioaugmenting field sites in 2007 (SaBRE) and 2009 (ISSO).
