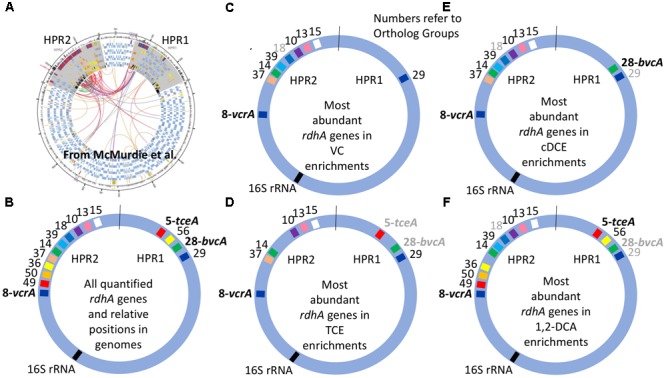
FIGURE 3.

Distribution of most abundant D. Mccartyi reductive dehalogenase homologous (rdhA) genes quantified in KB-1 enrichment cultures. RdhA sequences are represented by their corresponding ortholog group (OG) numbers and relative positions in High Plasticity Regions (HPR) 1 and 2, as defined by McMurdie et al. (2009).) (A) Circular map of four Dehalococcoides genomes reproduced from McMurdie et al. (2009), illustrating the two high plasticity regions where most rdhA genes are found; origin is at top. (B) Relative position of all of the rdhA sequences quantified by qPCR in this study. (C–F) Most abundant rdhA genes detected in the respective enrichment culture samples, with evidence for considerable strain variation within and between enrichment cultures. OG numbers that are gray correspond to genes that are abundant in only some of the samples from the respective enrichments. See Supplementary Table S3 or Figure 1 for correspondence between OG and KB-1 rdhA numbers.
