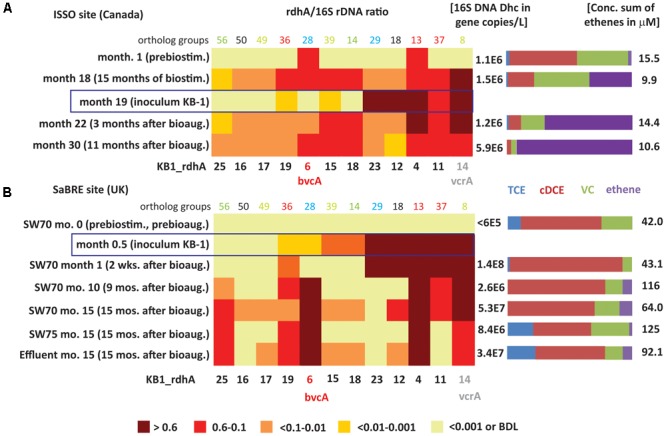
FIGURE 4.

Heatmaps showing D. mccartyi rdhA/16S rRNA gene copy ratios in field samples. (A) Canadian ISSO site. (B) United Kingdom SaBRE site. Corresponding absolute copies of D. mccartyi per L and concentrations of chlorinated ethenes are represented on the right side of each panel. Data from the ISSO site are from the composite pipeline (see Supplementary Figure S1). Data from the SaBRE site are from the influent (INF), sampling wells (SW70 and SW75) and effluent (EFF) of the test plot (see Supplementary Figure S2).
