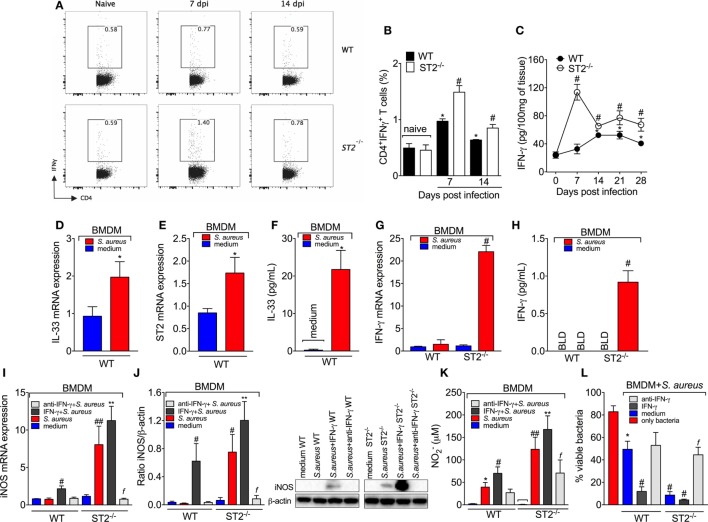
Figure 5.
ST2 deficiency enhances type 1-driven immune response against Staphylococcus aureus in septic arthritis S. aureus or saline was injected in in the femur-tibial joint of wild-type (WT) and ST2−/− mice. (A) Representative FACS plots and (B) the percentage of interferon-γ (IFN-γ)-producing CD4+T cells (CD4+IFNγ+T cells) from lymph node collected at day 7 and 14 post-infection and evaluated by flow cytometry, and (C) IFN-γ concentrations in the knee joints of WT and ST2−/− at 7–28 days post-infection determined by ELISA. bone marrow-derived macrophages (BMDMs) (1 × 10⁶) from naïve WT mice were incubated in vitro with S. aureus at a multiplicity of infection (MOI) of 3 for 18 h to assess: (D) interleukin-33 (IL-33) mRNA and (E) ST2 mRNA expression by qPCR, (F) IL-33 levels by ELISA. BMDMs (1 × 10⁶) from naïve WT and ST2−/− mice incubated in vitro with S. aureus at a MOI of 3 for 18 h to assess: (G) IFN-γ mRNA expression by qPCR and (H) IFN-γ levels by ELISA. BMDMs from naïve WT and ST2−/− mice preincubated 1 h in vitro with IFN-γ (100 IU/ml), anti-IFN-γ (10 µg/ml) or medium, followed by incubation with S. aureus at a MOI of 3 for 18 h to assess: (I) iNOS mRNA expression by qPCR, (J) iNOS protein expression by Western Blot, and (K) NO production determined as nitrite concentration by Griess reagent in the culture supernatant. (L) BMDMs (1 × 10⁶) from naïve WT and ST2−/− mice preincubated 1 h in vitro with IFN-γ (100 IU/ml), anti-IFN-γ (10 µg/ml), or medium, followed by incubation with S. aureus at a MOI of 3 for 3 h to assess bactericidal capability of BMDMs by Killing assay. N = 5 per group per in vivo experiment. *P < 0.05 vs WT naïve group (B) or vs day 0 of infection (C), #P < 0.05 vs WT mice group (B,C). Representative of two independent experiments. One-way ANOVA followed by Tukey’s test. For in vitro experiments: Samples were pooled from 5 mice per group, N 5 wells per group per in vitro experiment. *P < 0.05 vs WT medium group (D–F, K) or only bacteria group (L). #P < 0.05 vs WT S. aureus group (G–I) or vs WT medium (L), ##P < 0.05 vs WT IFN-γ + S. aureus group and WT S. aureus group (I,K), **P < 0.05 vs ST2−/− S. aureus group and WT IFN-γ + S. aureus group (I–K), fP < 0.05 vs ST2−/− S. aureus group (I–L). Representative of two independent experiments. One-way ANOVA followed by Tukey’s test.

