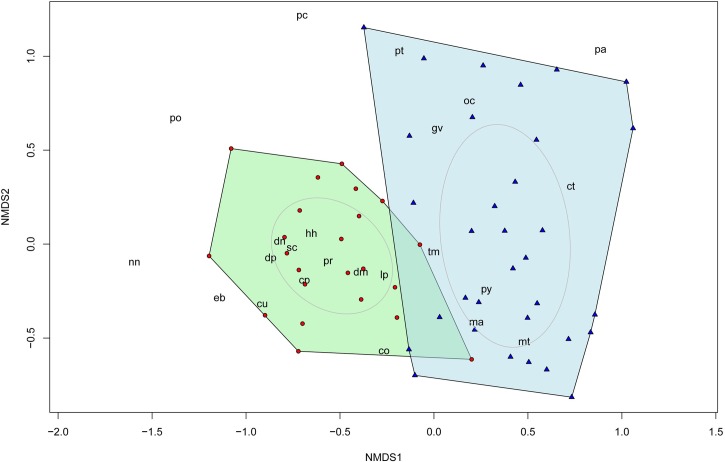
Fig 5. Overall mammal community composition across surveyed sites in oil palm plantations (triangles) and riparian forest (circles).
Plot is based on capture frequencies of species using Bray-Curtis non-metric multidimentional analysis (NMDS) (stress = 0.22). Polygons connect the vertices of each cover type and ellipses emphasize the centroids of the community in each land cover. Species outside the boundaries were very rare in the landscape. Codes correspond to the initial letters of the scientific names of each species (refer to S1 Table).

